A recently published letter to the New York Times reminds us that relativity is "just a theory" and so is the Big Bang. Scientists and science educators need to set the record straight on this "just a theory" meme any time we get a chance to discuss science with kids and grown-up nonscientists. So here's my shot at it.
A good analogy is to think of facts as being like bricks: solid and dependable, but one or a few bricks are not very useful by themselves ("an electron passed through my detector at 11:58:32.01" or "the high temperature in Davis, CA on September 1, 2013 was 96 F"). Only when we assemble lots (lots) of bricks into a coherent structure do we get the benefits of having a building (the theory of relativity, or a climate model). Not only is an isolated brick rather useless, but the building can easily survive the removal of a few bricks here and there. A good theory integrates millions or billions of observations into a coherent whole. Calling relativity "just a theory" is like calling the Great Wall of China "just a fence," the Panama Canal "just a ditch," or the Golden Gate Bridge "just a road."
There's a reason that calling the Great Wall of China "just a fence" sounds more outrageous than calling relativity "just a theory"---I used the word fence which connotes something less important than a wall. There's a rich vocabulary to describe to describe barriers: from weak to strong we might use tape, rope, cordon, railing, fence, and wall. But most people don't use a similarly rich vocabulary to describe levels of sophistication of mental models. From weak to strong I might suggest educated guess, working hypothesis, model, and theory, but most people in practice indiscriminately use the word theory for any of these. So it's our duty as scientists to make clear that well-accepted scientific theories integrate an incredible range of observations into a structure which is so coherent that it is difficult to imagine all those pieces fitting into any other structure. Maybe a better analogy to calling relativity "just a theory" is calling an assembled jigsaw puzzle "just one way to fit the pieces together."
Gotcha, the just-a-theory crowd says, by making that analogy you are showing that you are rigid in your thinking and unwilling to accept alternative explanations. Nonsense. Scientists are constantly trying to prove accepted theories wrong. Anyone who succeeds in disproving relativity, the Big Bang, or evolution will win a Nobel Prize and eternal fame, so we'd be happy to do so. But we know from experience that the most likely explanation for an isolated fact that seems to contradict relativity, the Big Bang, or evolution is that the fact itself was taken out of context or is not being properly interpreted, rather than that an extremely well-tested theory is wrong.
This doesn't mean that we will twist any fact to make it fit into our well-accepted theories. It does mean that surprising facts may end up extending the theory rather than replacing it. For example, Newton's theory of gravity explains a ton of observations about the motions of the planets and stars, but in a few extreme circumstances (such as very close to the Sun) it doesn't predict exactly what is observed. Einstein developed a theory of gravity (general relativity) which does correctly predict these situations. Einstein's theory is more complicated than Newton's, but in most situations the complicated parts of Einstein's theory have very little quantitative effect so we can simplify it a great deal and in those cases it turns out to be identical to....Newton's theory! This almost had to be the case, because Newton's theory accounted so well for so many observations that it would be hard to imagine that it was wrong rather than incomplete.
This example shows that a small number of facts can be critically important and that scientists do pay attention to facts which don't fit the theory. But we don't modify or overturn theories willy-nilly. When the planet Uranus didn't move exactly as Newton's theory predicted, modifications of the theory were considered but so was the possibility that some mass other than the Sun and the known planets was pulling on Uranus, and that led to the discovery of Neptune. If we rejected well-established theories at the first hint of any discrepancy with new observations, we would be giving undue weight to the new observations and too little weight to the vast range of previous observations explained by the theory. If you want to overthrow a theory because some new observation seems to contradict it, then give us a better theory which explains the new observation while still fitting the previous observations just as well as the old theory. That latter part seems to be conveniently forgotten by people who want to reject well-established theories.
A closely parallel situation is that of criminal investigators and prosecutors who present their "theory of the crime" to a jury. ("Model of the crime" would better fit my vocabulary hierarchy, but this is the word actually used.) A lot of facts may be introduced into evidence ("a car with the suspect's license plate was recorded crossing the Tappan Zee Bridge at 2:20am on August 31"), but by themselves they don't mean anything important. A good theory of the crime provides a coherent explanation of so many different facts that the jury is forced to conclude that it is true beyond a reasonable doubt. If you want to call it "just a theory" then offer us a different theory which fits the facts just as well. The defense is given sufficient time and strong motivation to offer a good alternative theory, so failure to present one is damning.
Monday, September 2, 2013

Tuesday, June 11, 2013
Great Balls of Fire
After learning about gravity and taking the midmorning break, the Peregrine 3-4 graders and I worked on understanding nuclear fusion in the core of the Sun and where elements come from.
I started by setting the context. The students had studied atoms and molecules the previous year so I started by drawing a molecule of water (two hydrogen atoms and one oxygen atom) and reminding them of the evidence for atoms and molecules. Then we zoomed in to one hydrogen atom and discussed the Rutherford experiment showing that atoms are very fluffy; most of their volume is nearly empty while nearly all their mass is concentrated in a tiny volume in the center (nucleus). Then we zoomed in further by a factor of 10,000 to the nucleus. For a hydrogen atom, the nucleus is a single positively charged particle called a proton. I held up a ping-pong ball as a proton and said that if protons really were that size, the atom would have to be the size of South Davis.
To reinforce the sense of scale, I showed the movie Powers of Ten. This classic ten-minute movie should be seen by anyone wanting to understand the universe. I also took the time to answer questions about it.
The basic rules of nuclear physics are actually understandable by anyone. Last year we investigated the effects of electrical charge, and concluded that like charges repel while opposite charges attract. Atoms beyond hydrogen in the periodic table have more protons. But why do the protons stick together if they repel each other? There must be some form of glue. I demonstrated two magnets which repelled each other. They were "donut" magnets threaded onto a rod so they didn't flop around and the repulsion was clear. But when I turned the rod vertically and one magnet fell with enough speed onto the other one, they touched briefly. That was enough for the velcro on their surfaces to attach and keep them together. The velcro is a short-range force, like the strong nuclear force which keeps a nucleus together.
But protons alone can't generate sufficient strong nuclear force to keep nuclei together. Another type of particle, with similar mass but no charge and called a neutron, provides the glue. Nuclei need roughly equal amounts of protons and neutrons to be stable. I modeled this with a bunch of ping-pong balls I had wrapped with velcro. The "protons" had velcro hooks and the "neutrons" had velcro loops, so that you needed roughly equal numbers of each to build up a large nucleus. (The different types were also different colors to make the idea plainly visible.) Adding a neutron to a nucleus adds mass, but doesn't otherwise change the properties of the atom. For example, a proton plus a neutron is still hydrogen, but we call it a different isotope of hydrogen. Similarly, carbon-12 (usually written with a superscript 12 on the left) and carbon-14 are different isotopes of carbon which differ by two neutrons.
With that in mind, we can start building up more complicated elements from hydrogen. Element number 2 (two protons) is helium, and we need two neutrons to provide the glue so the most common isotope of helium is helium-4. The protons have to be smashed together at very high speed if they are to ever get close enough for the "velcro" of the strong nuclear force to make them stick, so we need very high temperatures to make this fusion process happen. (High temperature means the individual microscopic particles are wiggling or bounding around at high speed.) We find it difficult to make these high temperatures on Earth, but the core of the Sun is 15 million degrees (Celsius; tens of millions of degrees if you think in Fahrenheit) and this happens quite routinely. In fact, most stars turn hydrogen into helium in their cores.
Fusing helium into even heavier elements is harder, but most stars will do that as well by the ends of their lives. It turns out that crashing two heliums together results in an unstable isotope of element 4 (beryllium), which quickly decays back into two helium-4 nuclei. But if you manage to crash a third helium into the two heliums before the two-helium complex has a chance to decay, you make carbon-12 (the most common isotope of element 6, carbon; again, equal amounts of protons and neutrons). Then, if you crash another helium into that, you get element number 8: oxygen. Another helium into that produces element 10, argon. These helium capture reactions are common in massive stars (substantially more massive than the Sun), and they create more of the even-numbered elements than the odd-numbered elements (nitrogen, fluorine, etc). They go all the way up to iron (element 26). I modeled all this with the velcro-covered ping-pong balls.
Have you noticed what we've done here? We've explained the origin of the elements using basic, well-understood physical processes. That's pretty cool! Here's a graph of the observed abundances:

You can see that hydrogen is the most abundant, followed by helium, then the even-numbered elements carbon, oxygen....through iron. But why are there elements beyond iron if stars only make up to iron? Well, stars make up to iron when they are in equilibrium. But when they explode (a supernova), so much energy is released that even more complicated nuclei can be made. I won't explain the details here, but the abundances of all the elements beyond iron are well understood as consequences of supernovae. That we can understand all the features of the above plot is, to me, one of the most amazing things in all of science.
The supernova explosions are also what throw the newly-manufactured elements back into space, where they can mix into gas clouds that eventually collapse to form new stars. That means that the atoms in your body were once inside another star. (Not from the Sun, because new atoms made in the Sun won't escape until the end of its life.)
Supernovae make some unstable elements, like uranium. The most common type of decay for a heavy element is to violently eject a "bullet" made of two protons and two neutrons, in other words a helium nucleus (again I modeled this with the ping-pong balls). This is why there is helium on Earth; our gravity is too weak to hold on to helium gas, but helium produced by radioactive decays is trapped in rocks underground. When we drill for natural gas, we can capture some of this helium and eventually use it to fill balloons. When it escapes from the balloon, it eventually escapes into space.
I started by setting the context. The students had studied atoms and molecules the previous year so I started by drawing a molecule of water (two hydrogen atoms and one oxygen atom) and reminding them of the evidence for atoms and molecules. Then we zoomed in to one hydrogen atom and discussed the Rutherford experiment showing that atoms are very fluffy; most of their volume is nearly empty while nearly all their mass is concentrated in a tiny volume in the center (nucleus). Then we zoomed in further by a factor of 10,000 to the nucleus. For a hydrogen atom, the nucleus is a single positively charged particle called a proton. I held up a ping-pong ball as a proton and said that if protons really were that size, the atom would have to be the size of South Davis.
To reinforce the sense of scale, I showed the movie Powers of Ten. This classic ten-minute movie should be seen by anyone wanting to understand the universe. I also took the time to answer questions about it.
The basic rules of nuclear physics are actually understandable by anyone. Last year we investigated the effects of electrical charge, and concluded that like charges repel while opposite charges attract. Atoms beyond hydrogen in the periodic table have more protons. But why do the protons stick together if they repel each other? There must be some form of glue. I demonstrated two magnets which repelled each other. They were "donut" magnets threaded onto a rod so they didn't flop around and the repulsion was clear. But when I turned the rod vertically and one magnet fell with enough speed onto the other one, they touched briefly. That was enough for the velcro on their surfaces to attach and keep them together. The velcro is a short-range force, like the strong nuclear force which keeps a nucleus together.
But protons alone can't generate sufficient strong nuclear force to keep nuclei together. Another type of particle, with similar mass but no charge and called a neutron, provides the glue. Nuclei need roughly equal amounts of protons and neutrons to be stable. I modeled this with a bunch of ping-pong balls I had wrapped with velcro. The "protons" had velcro hooks and the "neutrons" had velcro loops, so that you needed roughly equal numbers of each to build up a large nucleus. (The different types were also different colors to make the idea plainly visible.) Adding a neutron to a nucleus adds mass, but doesn't otherwise change the properties of the atom. For example, a proton plus a neutron is still hydrogen, but we call it a different isotope of hydrogen. Similarly, carbon-12 (usually written with a superscript 12 on the left) and carbon-14 are different isotopes of carbon which differ by two neutrons.
With that in mind, we can start building up more complicated elements from hydrogen. Element number 2 (two protons) is helium, and we need two neutrons to provide the glue so the most common isotope of helium is helium-4. The protons have to be smashed together at very high speed if they are to ever get close enough for the "velcro" of the strong nuclear force to make them stick, so we need very high temperatures to make this fusion process happen. (High temperature means the individual microscopic particles are wiggling or bounding around at high speed.) We find it difficult to make these high temperatures on Earth, but the core of the Sun is 15 million degrees (Celsius; tens of millions of degrees if you think in Fahrenheit) and this happens quite routinely. In fact, most stars turn hydrogen into helium in their cores.
Fusing helium into even heavier elements is harder, but most stars will do that as well by the ends of their lives. It turns out that crashing two heliums together results in an unstable isotope of element 4 (beryllium), which quickly decays back into two helium-4 nuclei. But if you manage to crash a third helium into the two heliums before the two-helium complex has a chance to decay, you make carbon-12 (the most common isotope of element 6, carbon; again, equal amounts of protons and neutrons). Then, if you crash another helium into that, you get element number 8: oxygen. Another helium into that produces element 10, argon. These helium capture reactions are common in massive stars (substantially more massive than the Sun), and they create more of the even-numbered elements than the odd-numbered elements (nitrogen, fluorine, etc). They go all the way up to iron (element 26). I modeled all this with the velcro-covered ping-pong balls.
Have you noticed what we've done here? We've explained the origin of the elements using basic, well-understood physical processes. That's pretty cool! Here's a graph of the observed abundances:
You can see that hydrogen is the most abundant, followed by helium, then the even-numbered elements carbon, oxygen....through iron. But why are there elements beyond iron if stars only make up to iron? Well, stars make up to iron when they are in equilibrium. But when they explode (a supernova), so much energy is released that even more complicated nuclei can be made. I won't explain the details here, but the abundances of all the elements beyond iron are well understood as consequences of supernovae. That we can understand all the features of the above plot is, to me, one of the most amazing things in all of science.
The supernova explosions are also what throw the newly-manufactured elements back into space, where they can mix into gas clouds that eventually collapse to form new stars. That means that the atoms in your body were once inside another star. (Not from the Sun, because new atoms made in the Sun won't escape until the end of its life.)
Supernovae make some unstable elements, like uranium. The most common type of decay for a heavy element is to violently eject a "bullet" made of two protons and two neutrons, in other words a helium nucleus (again I modeled this with the ping-pong balls). This is why there is helium on Earth; our gravity is too weak to hold on to helium gas, but helium produced by radioactive decays is trapped in rocks underground. When we drill for natural gas, we can capture some of this helium and eventually use it to fill balloons. When it escapes from the balloon, it eventually escapes into space.
Big Bang
I left out one detail in the story above: most of the helium in the plot was actually made in the Big Bang. Some of the kids had expressed interest in the Big Bang previously, so I used the remaining time to talk about that. I used the usual balloon-with-stickers demo, and I also showed this interactive tool made by an undergraduate student of mine. The point of the tool is to show that although we see all galaxies moving away from us, observers in all other galaxies also see all galaxies moving away from them. So we are not at the center of anything. If we think back in time, all galaxies were closer to each other, so the universe was denser (and hotter). Far enough back in time, the universe was so hot (everywhere) that a fair amount of hydrogen fused into helium. This is called Big Bang nucleosynthesis (BBN). We can look at the abundance of various BBN byproducts, like hydrogen-2 (aka deuterium) and confirm that this really happened.Wrapping up
Most of this trimester we worked on understanding the immense size of space. If this makes you feel insignificant, remember that you are made of atoms from another star. You are a part of the universe which can actually understand itself.Monday, June 10, 2013
The Gravity of the Situation
Friday was my last day doing astronomy with the 3-4 graders at Peregrine School. The one standard I hadn't yet covered was gravity, so we did gravity before the break (this post) and after the break we discussed nuclear fusion in the Sun's core (next post).
I reviewed some ideas about motion we had discussed last year. If you roll a marble, you expect it to go in a straight line unless something (another kid, perhaps, or a wall) interferes by pushing (exerting a force) on the marble. That's Newton's first law of motion. I then put a donut on a string and spun the donut in a circle over my head. What will happen if the string is cut? Will the donut continue in a circle, fly off in a straight line, or fly off in a curve? We took a vote. I always clarify that the question is about what happens immediately, not about what happens eventually, like the donut falling due to the gravity in the room. This means that when we do the experiment, they have to really pay attention!
In reality I don't cut the string, but the string pulls through the soft donut, and it flies off in a straight line---Newton's first law again. This is a pretty vivid demonstration that the Moon wouldn't keep going around the Earth, nor the planets around the Sun, unless there was a force keeping them from flying off in a straight line. Kids this age already know that we call that force gravity, but gravity is also the force that makes things fall when I drop them. Why do we call these two forces by the same name?
I also have a tennis ball on a string so I can demonstrate circular motion as much as needed. I do this and ask the kids what direction the force must be in. It must be towards the center of the circle, where my fist is holding the string. That's clear because the only direction a string can exert a force is pulling along the string! So whatever force is pulling on the Moon, it must be pointed toward the center of the Earth. And that's exactly what we observe about gravity on Earth! (It helps to draw an Earth and how the arrow of gravity points in your location vs in, say, Australia.) So it's quite plausible that these two forces are really the same force.
To bolster the argument that these are the same force, we should look not just at the direction, but also the strength. I had the kids whirl the tennis ball on a string at various speeds, and feel whether the higher speed requires more force, less force, or the same force (the answer is more). So let's look at the planets' speeds around the Sun and see if we can relate that to the force of gravity. I asked the kids for suggestions as to what would affect the planet speed. The two main suggestions were planet size, and planet distance from the Sun. It would have been great to investigate both of these possibilities, but we were running short on time so we just did planet distance from the Sun. I had the kids make graphs of planet speed vs planet distance from the Sun. We took our time doing this right, figuring out how to draw the axes with reasonable scales, and adding planets one by one, starting with the most familiar ones.
A pattern did emerge: more distant planets are slower, as the graph below shows.

By our tennis ball experiment, slower circular motion implies a weaker pull (less acceleration). Therefore this graph implies that more distant planets feel a weaker pull, and planets closer to the Sun feel a stronger pull. Does this make sense if the Sun's gravity is what keeps the planets from flying off in straight-line paths? The kids agreed that it did.
[If we had also made the graph of speed vs planet size, we would not have seen such a clear pattern. It happens that the outer planets tend to be bigger, so that there would be a tendency for bigger planets to be slower, but it would only be a tendency, not a law, because the biggest planet happens to be the nearest (fastest) of the outer four. And the pattern would really be broken if we also included Pluto, which is a very distant (hence very slow), small object, providing a counterexample to the fast inner planets which happen to be small and which therefore might give someone the false impression that small means fast.]
I liked this 40-minute activity and I think it worked well. I did simplify some details to avoid getting bogged down (eg the distinction between force and acceleration), but I think it was appropriate for 3-4 graders who wanted to focus on astronomy rather than physics. We also got in some more practice with graphs, which is important. And we learned something which in Newton's time was revolutionary: the same laws of physics which we can deduce here on Earth also apply to objects in the sky. This was one of the most wonderful discoveries in the history of science, and it's what allows us to understand the universe.
I reviewed some ideas about motion we had discussed last year. If you roll a marble, you expect it to go in a straight line unless something (another kid, perhaps, or a wall) interferes by pushing (exerting a force) on the marble. That's Newton's first law of motion. I then put a donut on a string and spun the donut in a circle over my head. What will happen if the string is cut? Will the donut continue in a circle, fly off in a straight line, or fly off in a curve? We took a vote. I always clarify that the question is about what happens immediately, not about what happens eventually, like the donut falling due to the gravity in the room. This means that when we do the experiment, they have to really pay attention!
In reality I don't cut the string, but the string pulls through the soft donut, and it flies off in a straight line---Newton's first law again. This is a pretty vivid demonstration that the Moon wouldn't keep going around the Earth, nor the planets around the Sun, unless there was a force keeping them from flying off in a straight line. Kids this age already know that we call that force gravity, but gravity is also the force that makes things fall when I drop them. Why do we call these two forces by the same name?
I also have a tennis ball on a string so I can demonstrate circular motion as much as needed. I do this and ask the kids what direction the force must be in. It must be towards the center of the circle, where my fist is holding the string. That's clear because the only direction a string can exert a force is pulling along the string! So whatever force is pulling on the Moon, it must be pointed toward the center of the Earth. And that's exactly what we observe about gravity on Earth! (It helps to draw an Earth and how the arrow of gravity points in your location vs in, say, Australia.) So it's quite plausible that these two forces are really the same force.
To bolster the argument that these are the same force, we should look not just at the direction, but also the strength. I had the kids whirl the tennis ball on a string at various speeds, and feel whether the higher speed requires more force, less force, or the same force (the answer is more). So let's look at the planets' speeds around the Sun and see if we can relate that to the force of gravity. I asked the kids for suggestions as to what would affect the planet speed. The two main suggestions were planet size, and planet distance from the Sun. It would have been great to investigate both of these possibilities, but we were running short on time so we just did planet distance from the Sun. I had the kids make graphs of planet speed vs planet distance from the Sun. We took our time doing this right, figuring out how to draw the axes with reasonable scales, and adding planets one by one, starting with the most familiar ones.
A pattern did emerge: more distant planets are slower, as the graph below shows.
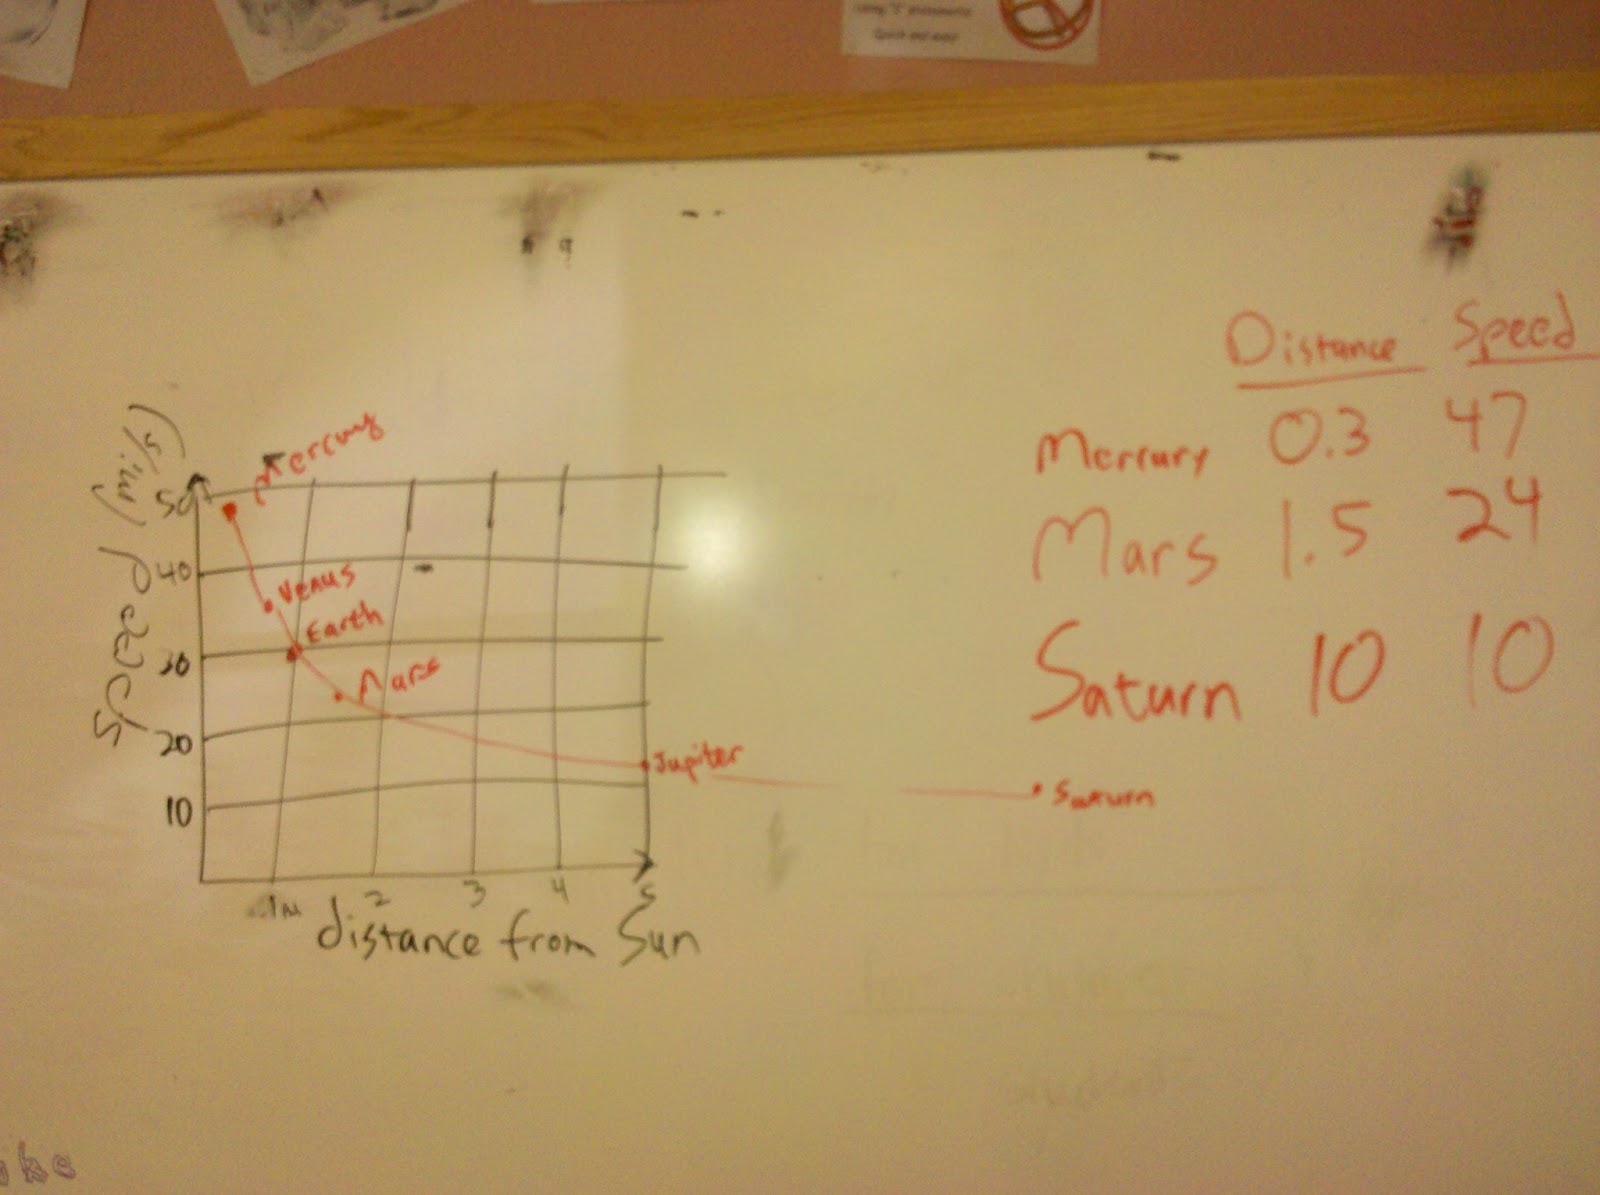
By our tennis ball experiment, slower circular motion implies a weaker pull (less acceleration). Therefore this graph implies that more distant planets feel a weaker pull, and planets closer to the Sun feel a stronger pull. Does this make sense if the Sun's gravity is what keeps the planets from flying off in straight-line paths? The kids agreed that it did.
[If we had also made the graph of speed vs planet size, we would not have seen such a clear pattern. It happens that the outer planets tend to be bigger, so that there would be a tendency for bigger planets to be slower, but it would only be a tendency, not a law, because the biggest planet happens to be the nearest (fastest) of the outer four. And the pattern would really be broken if we also included Pluto, which is a very distant (hence very slow), small object, providing a counterexample to the fast inner planets which happen to be small and which therefore might give someone the false impression that small means fast.]
I liked this 40-minute activity and I think it worked well. I did simplify some details to avoid getting bogged down (eg the distinction between force and acceleration), but I think it was appropriate for 3-4 graders who wanted to focus on astronomy rather than physics. We also got in some more practice with graphs, which is important. And we learned something which in Newton's time was revolutionary: the same laws of physics which we can deduce here on Earth also apply to objects in the sky. This was one of the most wonderful discoveries in the history of science, and it's what allows us to understand the universe.
Friday, May 31, 2013
Light and Telescopes
In the second half of this morning's activities with the 3-4 graders, we discovered some things about light and telescopes. I handed out diffraction gratings and we looked at the spectrum of the Sun and of the fluorescent lights in the room, discovering that white light is actually composed of many colors. We also looked at discharge tubes filled with different elements, with mercury and helium being the stars. We found that each element emits a unique "fingerprint" of spectral lines. To see a great 2-minute video of everything the kids saw, check this out. This is how we know what stars and other planets are made of.
We then discussed how the colors always appear in a certain order in a rainbow or a diffraction grating: red, orange, yellow, green, blue, violet. Could there be any light which appears before red? Yes, it's called infrared, and we can build cameras to see it even though our eyes can't. I showed this nice video demonstrating the properties of infrared light. Could there be any light which appears after violet? Yes, ultraviolet, and after that would be X-rays and finally gamma rays. We talked about X-rays for a while because some kids were worried about it being dangerous. (Like many other things, they are safe if used properly, but dangerous if not. A yearly dental X-ray is ok, but how do we protect the parts of our bodies which don't need to be X-rayed? And how do we protect the workers who administer dozens of X-rays each day?) I extended that discussion to the ultraviolet and sunlight.
All this was a springboard for discussing telescopes, which is one of the last astronomy standards I hadn't covered yet. Specialized telescopes are built to look at all kinds of light, from gamma rays to the infrared and radio. I showed pictures of some of the big telescopes I have used in my research, and that led to all kinds of interesting questions. We ran out of time, so I may start next Friday by answering more telescope questions.
We then discussed how the colors always appear in a certain order in a rainbow or a diffraction grating: red, orange, yellow, green, blue, violet. Could there be any light which appears before red? Yes, it's called infrared, and we can build cameras to see it even though our eyes can't. I showed this nice video demonstrating the properties of infrared light. Could there be any light which appears after violet? Yes, ultraviolet, and after that would be X-rays and finally gamma rays. We talked about X-rays for a while because some kids were worried about it being dangerous. (Like many other things, they are safe if used properly, but dangerous if not. A yearly dental X-ray is ok, but how do we protect the parts of our bodies which don't need to be X-rayed? And how do we protect the workers who administer dozens of X-rays each day?) I extended that discussion to the ultraviolet and sunlight.
All this was a springboard for discussing telescopes, which is one of the last astronomy standards I hadn't covered yet. Specialized telescopes are built to look at all kinds of light, from gamma rays to the infrared and radio. I showed pictures of some of the big telescopes I have used in my research, and that led to all kinds of interesting questions. We ran out of time, so I may start next Friday by answering more telescope questions.
Scale Model Solar System Complete!
This morning I guided the 3-4 graders through assembling our scale model solar system. I wanted them to really think about how to make a scale model, so I returned to each student the graph they had made last time and I asked them to use the graph to figure out where they would put their planet, given that I had put Teacher Moné's beautiful Earth poster 2.5 meters from the Sun poster. Of course, I found that I needed to break this task into smaller chunks for them to process. We began by revisiting some of the steps we had done last week. Each child identified his/her planet on the graph, read its distance off the graph, and then we thought about what that distance means. For example, Jupiter is at a distance of 5 on the graph. Five what? The graph doesn't say. But the graph itself is a scale model of the solar system. We don't really care what the actual distance is because we are simply stretching this scale model to become a larger scale model which will fill the school. All we need to do is choose a reference point and stretch everything else accordingly. The graph made this easy because it shows Earth as being at a distance of 1. So if Jupiter is at 5, we simply need to put Jupiter 5 times farther from the Sun than Earth is from the Sun; in other words 5x2.5 meters or 12.5 meters.
To help the kids visualize this, I took a rubber band and marked three dots on it, representing Sun, Earth, and Jupiter. This is a scale model much like the graph (if we ignore the vertical dimension of the graph). If I stretch the rubber band, will Jupiter still be 5 times more distant from the Sun than the Earth is from the Sun? Some kids said no and some said yes, so we took a vote. Having to commit to a vote made the kids think harder and they voted overwhelmingly yes. After the vote I did stretch the rubber band and I did get a bigger scale model. In principle, if we got a really long rubber band, I could mark all the planets' distances at the scale of the graph and then stretch it out to get a giant scale model as big as the school, and that would tell us where to put each planet poster. But since that's impractical, we do the math instead.
This seems to have been more or less the right level of conceptual challenge and the right level of math for the kids. They found it a bit of a challenge, but a doable one that became satisfying rather than frustrating. After looking over each child's computation, we practiced some metacognition. Alex was concerned that his number didn't make sense given what he knew about the relative positions of the Sun, Earth and Venus. It turned out that he was misinterpreting his number as the Earth-Venus distance, but the point was a really important one: always check that your numerical results make sense! I have had so many students make a mistake punching numbers into a calculator, and get a number that obviously doesn't make sense given a moment's thought, but blithely write down the number as if any number displayed by a calculator must be correct. In this case we wrote out the multiplication rather than use a calculator, but the same principle applies: check that the results actually make sense! This goes not only for numbers that you compute, but also for numbers that other people compute for you.
An especially effective way to double-check your number is to perform some completely different procedure; if you just perform the original procedure again, you may easily make the same mistake again. So I thought of a way we could all check our numbers without recomputing anything. I made a list of the students' results, starting with the closest planet and proceeding outward. If the distance numbers didn't increase steadily, that would be a smoking gun indicating a mistake. And we did find a mistake this way, so it was instructive.
Once we had our final numbers, we split into groups to measure off the distances and attach the posters to the walls. We couldn't quite fit Neptune into the school grounds, and Orcus wasn't even close, but we put them up at the far end with a note saying where they should really be. Even after choosing a scale so large that the orbit of Neptune was just outside the fence, the sizes of the planets are really small, smaller than a grain of sand for most planets. Even Jupiter is only 2.4mm across. Space is really big!
Looking at the finished product, I am really happy we did it and spent enough time on it to do it right. We certainly appreciate the solar system much better now, but we also learned new ways of thinking.
To help the kids visualize this, I took a rubber band and marked three dots on it, representing Sun, Earth, and Jupiter. This is a scale model much like the graph (if we ignore the vertical dimension of the graph). If I stretch the rubber band, will Jupiter still be 5 times more distant from the Sun than the Earth is from the Sun? Some kids said no and some said yes, so we took a vote. Having to commit to a vote made the kids think harder and they voted overwhelmingly yes. After the vote I did stretch the rubber band and I did get a bigger scale model. In principle, if we got a really long rubber band, I could mark all the planets' distances at the scale of the graph and then stretch it out to get a giant scale model as big as the school, and that would tell us where to put each planet poster. But since that's impractical, we do the math instead.
This seems to have been more or less the right level of conceptual challenge and the right level of math for the kids. They found it a bit of a challenge, but a doable one that became satisfying rather than frustrating. After looking over each child's computation, we practiced some metacognition. Alex was concerned that his number didn't make sense given what he knew about the relative positions of the Sun, Earth and Venus. It turned out that he was misinterpreting his number as the Earth-Venus distance, but the point was a really important one: always check that your numerical results make sense! I have had so many students make a mistake punching numbers into a calculator, and get a number that obviously doesn't make sense given a moment's thought, but blithely write down the number as if any number displayed by a calculator must be correct. In this case we wrote out the multiplication rather than use a calculator, but the same principle applies: check that the results actually make sense! This goes not only for numbers that you compute, but also for numbers that other people compute for you.
An especially effective way to double-check your number is to perform some completely different procedure; if you just perform the original procedure again, you may easily make the same mistake again. So I thought of a way we could all check our numbers without recomputing anything. I made a list of the students' results, starting with the closest planet and proceeding outward. If the distance numbers didn't increase steadily, that would be a smoking gun indicating a mistake. And we did find a mistake this way, so it was instructive.
Once we had our final numbers, we split into groups to measure off the distances and attach the posters to the walls. We couldn't quite fit Neptune into the school grounds, and Orcus wasn't even close, but we put them up at the far end with a note saying where they should really be. Even after choosing a scale so large that the orbit of Neptune was just outside the fence, the sizes of the planets are really small, smaller than a grain of sand for most planets. Even Jupiter is only 2.4mm across. Space is really big!
Looking at the finished product, I am really happy we did it and spent enough time on it to do it right. We certainly appreciate the solar system much better now, but we also learned new ways of thinking.
Friday, May 24, 2013
Planet Posters
Two weeks ago each student chose a planet (or other solar system object) to research and make a poster about. Today they brought in their posters, and each student told the class what they learned in their research. The kids were very engaged and asked so many good questions that we spent all morning doing this. So next week we will put up the posters at the appropriate distances from the Sun poster (which I made and put up near the school entrance today) to make a scale model of the solar system. The discussions today were so full, frank, and wide-ranging that I can't hope to capture them in a blog post. I will simply leave you with a short video with amazing images of Jupiter's moon Europa.
I think the posters were quite successful as a learning experience. The kids learned by researching and making them, but they also learned by listening to other kids talk about their posters, and they all learned when I answered numerous questions in more depth as they arose. I think a key to real learning is that the posters should not be just a laundry list of facts, but should really be based on the students' questions. When I issued the assignment, I offered some questions they might be interested in answering:
I think the posters were quite successful as a learning experience. The kids learned by researching and making them, but they also learned by listening to other kids talk about their posters, and they all learned when I answered numerous questions in more depth as they arose. I think a key to real learning is that the posters should not be just a laundry list of facts, but should really be based on the students' questions. When I issued the assignment, I offered some questions they might be interested in answering:
- What would it be like to visit? What is the temperature? Is there a solid surface? Would the Sun look bright from that distance? If the temperature is extreme, think about ways to convey how extreme it is.
- Does the planet have moons or rings? If you chose a moon to begin with, briefly describe the host planet.
- What are seasons like on that planet? This depends on how tilted the planet is with respect to its orbit.
- How long is the year on that planet? How long is a day?
- Are there volcanoes? Rocks? Rivers/lakes/oceans? (If so, are they made of water or some other substance? Moons of Jupiter and Saturn are especially interesting in this respect.) Clouds? Earthquakes? Storms? Lightning?
- Could you possibly find life there?
Our Solar System, Graphs, and Classification Schemes
Following the previous week's intro to the solar system, on Friday May 17 I visited the 3-4 grade room and used the solar system as a context for practice with graphs. We used the graphs in turn as a tool for helping us think about how to classify solar system objects. By establishing several clearly different classes of solar system objects, we raised questions about how the solar system might have formed these different classes, and we even began to answer those questions. I think this worked quite well as a coherent activity while asking the students to practice a variety of skills.
The centerpiece was a graph (technically a scatterplot*) of size vs distance from Sun for various solar system objects. My first idea was to help the kids make their own graphs from a table of data, but I discarded that idea as requiring too much time before we got to any science. So I made this graph and handed out a copy to each student:

I still wanted students to graph some data, so I planned to make them analyze and understand this graph as a gateway to getting them to add more points and do more analysis. I think this plan went well. I started with the question: can you identify any of the points? This required them to think about the meaning of the axes, and once they understood, they started saying things like "the top one must be Jupiter, because it's the biggest planet" and "the one most to the right must be Neptune because it's most distant from the Sun." Once they grasped that, they were able to label more and more points until we eventually got them all. (The word "eventually" hides a lot of time spent one-on-one with kids, helping them with the reasoning. Eg, Earth and Venus are almost exactly the same size, but Earth is a bit bigger, so which point is Earth? Double-check your conclusion by looking at distance from the Sun. Does it make sense? Etc.)
This was an excellent activity to make them think about the meaning of the graph rather than getting caught up in big numbers which wouldn't mean much to them anyway. (Jupiter is 90,000 miles across? How big is that?) But now let's think about the numbers. The graph says Earth's distance from the Sun is 1. What is that? One foot? One billion miles? The only unit that makes sense is units of "Earth-Sun distance." In other words, the graph makes it easy to read off the relative distances of the planets. It's a scale model. Again, this makes it easy to think about what the solar system is without getting caught up in a bunch of meaningless numbers. We repeated that exercise with the vertical axis.
Then we looked at whether the planets form any distinct groups. The graph makes it clear that there are two groups: small and close to the Sun, vs large and far from the Sun. What other differences might these groups have? It turns out that the large ones are made of different stuff (mostly gas vs rock), so maybe we should really think of two types of planets (gas giants and rocky planets) rather than thinking that all things called "planet" are similar things.
Next, I took them back to the year 1801 when a new planet was discovered: Ceres. I gave them the Ceres-Sun distance in units of the Earth-Sun distance (2.77) and Ceres' size in Earth-size units (0.07) and asked them to put Ceres on the graph. For the faster students, I gave them three more planets which were discovered soon after Ceres (Pallas**, Juno, and Vesta, which have similar distances and sizes) while the teachers helped the slower students with the graphing. After graphing these, it's clear that they form a distinct group: a group of very small things between Mars and Jupiter. Today we call these things main-belt asteroids, but when they were discovered they were simply called new planets. It was only after discovering many of them that people began to think that maybe we shouldn't call all new discoveries planets, and especially not these new discoveries which clearly form a separate group. The way we think about things is highly dependent on how much information we have.
This took until the break. After the break, we added Pluto to the graph. When Pluto was discovered, it was immediately called a planet because it was much larger than any asteroid, and there was no other category it could have been assigned to. But it does seem a bit out of place on the graph, being substantially smaller than any of the eight planets we started with, and also breaking the pattern of the larger planets being farther from the Sun. Well, it took 60 years, but eventually astronomers started discovering lots of other things roughly as far from the Sun and roughly the same size. I gave the kids data for these new objects: Eris, Sedna, Quaoar, and Orcus to start with.
Just as with the asteroids, it became clear that things like Pluto form a new category: the Kuiper Belt. This is even more clear when we realize that all these things are made of ices***, which is not like the inner planets or the outer planets. Once this new category was recognized, it became silly to continue calling Pluto a planet, just as in the 1800's it became silly to continue calling Ceres, Pallas, Juno, and Vesta planets. Perhaps Pluto should have been in a category of its own from the start, but there was no available category other than "planet," and why create a new category just for one object? Another illustration that the way we think about things depends on how much information we have.
[A side note: astronomers created the additional category "dwarf planet" to describe a body which, regardless of its location, is large enough that its gravity pulls it into a round shape (but smaller than the eight planets). Thus Pluto is both a Kuiper Belt object and a dwarf planet just as I am both a teacher and a father---they are not exclusive categories. But "Kuiper Belt object" is a much more descriptive term because it implies being made of ice, being a certain distance from the Sun, etc, whereas "dwarf planet" implies only that the size is neither very large nor very small.]
Next, we talked about how the solar system might have formed in order to form these different classes of objects. I showed clips from the Birth of the Earth episode of the series How the Earth Was Made. It has some really nice visualizations, and it is constructed around evidence, which is a key feature missing from most science documentaries. It tells science like the detective story it is. We spent probably half an hour on this, but I won't write much here because it's already a long blog post.
To cap off this intense morning, I brought some liquid nitrogen to demonstrate how cold the outer planets are. I froze a racquetball and shattered it just by trying to bounce it off the floor; I froze a banana and showed how it can be used as a hammer (until it shattered), and I made a balloon shrink and then expand again as I warmed it up. LN2 is always a great hit with the kids. On Pluto summers can be just warm enough to vaporize some nitrogen, but right about now Pluto is in early fall, and it will get so cold that nitrogen will not only liquify, it will freeze.
**I got the idea for some of this activity when I saw that the element palladium was so named because for a long time it was fashionable to name newly discovered elements after recently discovered planets. I was long aware of uranium, neptunium, and plutonium being named this way, but I had never made the connection to cerium and palladium. People really thought that asteroids were planets until enough asteroids were discovered.
***Ices includes ice made of materials other than water, such as methane, ammonia, etc.
The centerpiece was a graph (technically a scatterplot*) of size vs distance from Sun for various solar system objects. My first idea was to help the kids make their own graphs from a table of data, but I discarded that idea as requiring too much time before we got to any science. So I made this graph and handed out a copy to each student:

I still wanted students to graph some data, so I planned to make them analyze and understand this graph as a gateway to getting them to add more points and do more analysis. I think this plan went well. I started with the question: can you identify any of the points? This required them to think about the meaning of the axes, and once they understood, they started saying things like "the top one must be Jupiter, because it's the biggest planet" and "the one most to the right must be Neptune because it's most distant from the Sun." Once they grasped that, they were able to label more and more points until we eventually got them all. (The word "eventually" hides a lot of time spent one-on-one with kids, helping them with the reasoning. Eg, Earth and Venus are almost exactly the same size, but Earth is a bit bigger, so which point is Earth? Double-check your conclusion by looking at distance from the Sun. Does it make sense? Etc.)
This was an excellent activity to make them think about the meaning of the graph rather than getting caught up in big numbers which wouldn't mean much to them anyway. (Jupiter is 90,000 miles across? How big is that?) But now let's think about the numbers. The graph says Earth's distance from the Sun is 1. What is that? One foot? One billion miles? The only unit that makes sense is units of "Earth-Sun distance." In other words, the graph makes it easy to read off the relative distances of the planets. It's a scale model. Again, this makes it easy to think about what the solar system is without getting caught up in a bunch of meaningless numbers. We repeated that exercise with the vertical axis.
Then we looked at whether the planets form any distinct groups. The graph makes it clear that there are two groups: small and close to the Sun, vs large and far from the Sun. What other differences might these groups have? It turns out that the large ones are made of different stuff (mostly gas vs rock), so maybe we should really think of two types of planets (gas giants and rocky planets) rather than thinking that all things called "planet" are similar things.
Next, I took them back to the year 1801 when a new planet was discovered: Ceres. I gave them the Ceres-Sun distance in units of the Earth-Sun distance (2.77) and Ceres' size in Earth-size units (0.07) and asked them to put Ceres on the graph. For the faster students, I gave them three more planets which were discovered soon after Ceres (Pallas**, Juno, and Vesta, which have similar distances and sizes) while the teachers helped the slower students with the graphing. After graphing these, it's clear that they form a distinct group: a group of very small things between Mars and Jupiter. Today we call these things main-belt asteroids, but when they were discovered they were simply called new planets. It was only after discovering many of them that people began to think that maybe we shouldn't call all new discoveries planets, and especially not these new discoveries which clearly form a separate group. The way we think about things is highly dependent on how much information we have.
This took until the break. After the break, we added Pluto to the graph. When Pluto was discovered, it was immediately called a planet because it was much larger than any asteroid, and there was no other category it could have been assigned to. But it does seem a bit out of place on the graph, being substantially smaller than any of the eight planets we started with, and also breaking the pattern of the larger planets being farther from the Sun. Well, it took 60 years, but eventually astronomers started discovering lots of other things roughly as far from the Sun and roughly the same size. I gave the kids data for these new objects: Eris, Sedna, Quaoar, and Orcus to start with.
Just as with the asteroids, it became clear that things like Pluto form a new category: the Kuiper Belt. This is even more clear when we realize that all these things are made of ices***, which is not like the inner planets or the outer planets. Once this new category was recognized, it became silly to continue calling Pluto a planet, just as in the 1800's it became silly to continue calling Ceres, Pallas, Juno, and Vesta planets. Perhaps Pluto should have been in a category of its own from the start, but there was no available category other than "planet," and why create a new category just for one object? Another illustration that the way we think about things depends on how much information we have.
[A side note: astronomers created the additional category "dwarf planet" to describe a body which, regardless of its location, is large enough that its gravity pulls it into a round shape (but smaller than the eight planets). Thus Pluto is both a Kuiper Belt object and a dwarf planet just as I am both a teacher and a father---they are not exclusive categories. But "Kuiper Belt object" is a much more descriptive term because it implies being made of ice, being a certain distance from the Sun, etc, whereas "dwarf planet" implies only that the size is neither very large nor very small.]
Next, we talked about how the solar system might have formed in order to form these different classes of objects. I showed clips from the Birth of the Earth episode of the series How the Earth Was Made. It has some really nice visualizations, and it is constructed around evidence, which is a key feature missing from most science documentaries. It tells science like the detective story it is. We spent probably half an hour on this, but I won't write much here because it's already a long blog post.
To cap off this intense morning, I brought some liquid nitrogen to demonstrate how cold the outer planets are. I froze a racquetball and shattered it just by trying to bounce it off the floor; I froze a banana and showed how it can be used as a hammer (until it shattered), and I made a balloon shrink and then expand again as I warmed it up. LN2 is always a great hit with the kids. On Pluto summers can be just warm enough to vaporize some nitrogen, but right about now Pluto is in early fall, and it will get so cold that nitrogen will not only liquify, it will freeze.
Notes
*Notice that this graph is not a histogram, which seems to be the only type of graph elementary teachers ever work with. I see that kids start working with graphs around second grade if not earlier, so by the time they get to college, they should be highly proficient. But in my college classes that students are typically far from proficient. My guess is that much of the time spent on graphs in school is wasted because students are never introduced to the idea of graphing the relationship between two different abstract quantities, which is absolutely key to data analysis and science.**I got the idea for some of this activity when I saw that the element palladium was so named because for a long time it was fashionable to name newly discovered elements after recently discovered planets. I was long aware of uranium, neptunium, and plutonium being named this way, but I had never made the connection to cerium and palladium. People really thought that asteroids were planets until enough asteroids were discovered.
***Ices includes ice made of materials other than water, such as methane, ammonia, etc.
Subscribe to:
Posts (Atom)