We've been bombarded all winter with stories of cold and snowy weather in the eastern US, but the news was just released that January 2014 was the fourth-warmest January on record. How can this be? The eastern US covers less than 1% of the Earth's area, so (as this essay nicely puts it) "if the whole country somehow froze solid one January, that would not move the needle on global temperatures much at all." That essay is worth reading because it goes on to explain how subjectively people do perceive global warming: something as unrelated to global warming as being in a cold room does have an influence on the opinions voiced in a survey. Educators should be aware of this, and actively work on making students think objectively and use data.
Showing posts with label weather. Show all posts
Showing posts with label weather. Show all posts
Friday, February 21, 2014
Friday, March 29, 2013
Cold and Clammy
After spending most of the morning studying the dynamics of sand along California's beaches, I had about 30 minutes left to tie up some loose ends I had left on my last visit. On that visit, I had promised that I could catastrophically crush an aluminum soda can using just heat and cold, but it didn't work. As soon as I left the school that day, I realized what I had done wrong, but instead of just explaining what I did wrong, I planned some activities to build up to an explanation. The first was measuring the dew point in the room. (Note: there are lots of dew-point activities written up on the web; I'm just linking to a random one here out of laziness. In particular, I saved time compared to the activity in this link by starting with cool rather than warm water.) The dew point was about 10 C, in a room with a temperature of about 20 C. I also had them answer some questions related to dew point, such as: Which city would you rather travel to, one where the dew point is 50 F or one where it is 80 F? Explain why, and suggest a plausible location for each city.
Then we related dew point to relative humidity. I wanted to make a graph of amount of water that air holds, vs temperature of the air. At any temperature, there is a maximum amount it can hold, so I can sketch this maximum amount as a curve which changes with temperature. I elicited from them how I should sketch it: the warmer the air, the more water it can hold. On that same graph, how would we represent the air in this room? We know it's 20 C, and we know the amount of water in the air is substantially less than the maximum---if it were close to the max we would have seen condensation very quickly as soon as we began to cool the glass. So I made a mark indicating that conceptually. As we cooled the glass, we lowered its temp, so I drew a line going leftward from that point. When it hits the max curve, it condenses.
So the dew point is an indication of how much water is in the air, but what we feel as humidity is really how much water is in the air relative to the maximum it could hold at that temperature. This is called relative humidity. For example, the dew point was about 10 C, or about 50 F, and in a 70 F room that doesn't feel humid. But in a 52 F room, that would feel clammy as well as cool. So I asked the kids to brainstorm how they could build a device to measure relative humidity. To my surprise (because I was hearing some whining) someone came up really quickly with the idea of a wet thermometer. I said "Brilliant!" and tried to elicit more details. Why is being wet important? Because then there will be evaporation. OK, how will evaporation change your thermometer reading? There was much discussion of this, with about half the class leaning toward warmer and half toward colder, but eventually I steered them toward thinking about getting out of a swimming pool and feeling cold as all those little water drops on your skin evaporate. The thermometer will definitely read a colder temperature! So how does this help you determine humidity? Well, if the air is very humid already, there won't be much evaporation, so the wet thermometer won't read much colder than a dry thermometer. If the air is very dry, there will be a lot of evaporation and the wet thermometer will read much colder than a dry thermometer. So we did the experiment, and we found about 16 C (61 F) for the wet one and 20 C (70 F) for the dry one. Then we find a table which tells us the relative humidity as a function of dry-bulb temp and the temperature difference between dry and wet bulbs.
Now for the grand finale. I reminded them how much a substance expands when going from liquid to gas. Similarly, when a gas condenses to liquid, it occupies much less volume. So I put a small amount of water into an empty aluminum soda can, heat the can with a torch so that the gas in the can is mostly water vapor, then plunge the can upside-down into an ice bath. The water vapor in the can condenses quickly. Suddenly, there's a lot of empty space in the can, and it collapses catastrophically because the pressure on the outside of the can (standard atmospheric pressure) is so much greater than the pressure on the outside of the can (very little because the gas is gone). When I tried to do this demo previously, I was not cognizant of the key role of condensation and I put very little ice into a giant pail of water, virtually guaranteeing that I would not get condensation. You can see a video of this kind of demo here. It was a satisfying conclusion. Three kids wanted to take crushed cans home for keepsakes.
Wednesday, March 20, 2013
Making Clouds in a Bottle
As our final activity in our March 12 physics-behind-the-weather extravaganza, we made clouds in a bottle, pretty much as shown in this video. This experiment shows that to form clouds we need three things: humid air, a change in temperature/pressure which brings the air below the dew point, and condensation nuclei, which are provided by particles in the smoke we waft into the bottle. Without these, water droplets tend not to form; see the Wikipedia article on supersaturation.
After many minutes of squeezing to see the clouds form and releasing to see the clouds disappear, they tended to stop forming. I think that must be due to the particles being driven into the liquid water rather than floating in the air.
This was a relatively quick (~15 minutes) activity, but I was surprised at how the kids had problems getting the smoke into the bottle. They didn't think about how the bottle had to exhale before it could inhale the smoke. I didn't trust the kids with matches, so I was quite busy servicing the kids as they each tried to get smoke multiple times. My advice to teachers is to have several adults help if you do this with a larger number of kids.
Friday, March 15, 2013
Balloon in a bottle
This is a great demo for making air pressure dramatically visible.
The "bottle" is a special flask with a hole in the bottom. Stuff most
of a limp balloon into the neck of the flask, mount the balloon's neck
onto the flask's neck, and inflate the balloon. When you take your
mouth off the balloon, it deflates, of course. Ask your audience to
predict what will happen if you put the stopper in before taking your
mouth off. Now inflate the balloon again, insert the stopper in the
hole at the bottom of the flask, take your mouth off, and TA-DA! The
balloon does not deflate, despite having its mouth held wide open by
the neck of the flask! This is really an astounding demo, and people
are delighted every time I do it.
The key to understanding this is that inflating the balloon pushes air
out of the flask through the hole in its bottom. With no stopper, air
rushes back in through the same hole when the balloon deflates. But
with a stopper, pulling air back in to the flask is not possible. As
soon as the balloon deflates just a tiny bit, the same amount of air
in the flask must occupy a larger volume, which means it lowers its
pressure. Each square inch of latex in the balloon's surface now
starts to feel a higher pressure from the inside of the balloon than
from the outside of the balloon, so it can't deflate any more.
(Experts: I am purposely omitting surface tension to keep it
simple for a young audience.) If you now remove the stopper, it
quickly deflates by drawing air into the flask through the newly made
hole.
There are further variations such as pouring water in the balloon
before removing the stopper (which creates a nice squirt of water when
you do remove the stopper).
If you can't find this specialized flask, you may be able to do a
similar demo with a regular bottle by using a straw in parallel with
the balloon to vent the bottle as you inflate the balloon. From the
videos I've seen, it takes some dexterity and practice to do this and
remove the straw to prevent further air flow at the critical moment,
but it is doable.
I did this Tuesday with the upper-graders at Peregrine School to
introduce pressure to our study of weather. Pressure is related to
temperature; pumping up a bike tire shows that compressing a gas
raises its temperature, and there are demos I will describe in a
future post which show how cooling a gas makes its pressure drop. So
hot air masses are associated with high pressure, and cool air masses
(and storms) are associated with low pressure. In low-pressure storms
like hurricanes, air is pushed from higher-pressure regions on the
periphery toward the center. Combining this with what we had just
learned about the Coriolis effect, we see that in the northern
hemisphere air will be deflected to its right, making a
counterclockwise circulation which is easily seen in satellite images:
In the southern hemisphere, air is deflected to its left as it tries
to go from outskirts to center, thus creating clockwise circulation.
We saw in our previous activity that the Coriolis effect cannot
determine the circulation in toilet bowls because a few inches' travel
is too small to be affected by riding on the 12,000-mile
merry-go-round we call Earth. But over hundreds of miles, the
Coriolis effect does build up and cause these wind patterns.
The next and last activity in our physics-behind-the-weather extravaganza was making clouds.
Thursday, March 14, 2013
Coriolis Effect
After learning how convection makes air "want" to circulate from
equator to pole at high altitudes and back from pole to equator at low
altitudes, we learned how that idealized picture of air flow is
modified by the Coriolis effect.
I won't explain the effect here, because there are plenty of good Web
resources on that, with MIT providing perhaps the best demo. As a
teacher, my quandary was whether to simply show the video of this
demo, or to try to actually do it in class. I took a risk on the
latter, and it worked out amazingly well. I built something like the
contraption shown in the MIT video, by borrowing a sturdy turntable (a
low one, much lower than a pottery turntable, so that a fall from it
would not hurt) and clamping a 2"x12"x8' plank to it. I put a kid on
each end, asked them to take some practice throws, and the spun it and
had them throw at will. They had a blast! Everyone insisted on taking
a turn---multiple turns---so we had plenty of chances to explore the
effects of different variables, such as direction of rotation, speed
of rotation, and distance over which the ball travels. When break
time arrived, the kids just kept playing with it, and kids from other
grades also came in the room and demanded their turn. I can honestly
say this was the most fun science activity I have done with kids.
They begged me to leave the device at school, but I did not leave it
because it would require constant adult supervision to keep it safe.
I strongly urge anyone teaching the Coriolis effect to do this
activity. The activity described in this post took about an hour, but
kids could play with this device for many hours. If you don't think
you can build one, a merry-go-round should provide a good substitute.
Back in discussion mode, we took some time to understand that Earth's
northern hemisphere is like a merry-go-round spinning
counterclockwise, so when low-altitude air tries to circulate from
pole to equator it gets deflected to the right and becomes a wind from
the northwest, whereas when high-altitude air tries to circulate from
equator to pole it gets deflected to the right and becomes a wind from
the southwest. This means that one giant circulation cell from
equator to pole and back is not feasible; it gets broken up into three
cells, from equator to about 30 degrees latitude, from 30-60 degrees
latitude, and from latitude 60 to the pole:
 |
| (Image from Wikipedia) |
The sourthern hemisphere is like a merry-go-round spinning clockwise,
so its air circulation cells (called Hadley cells) are a mirror image
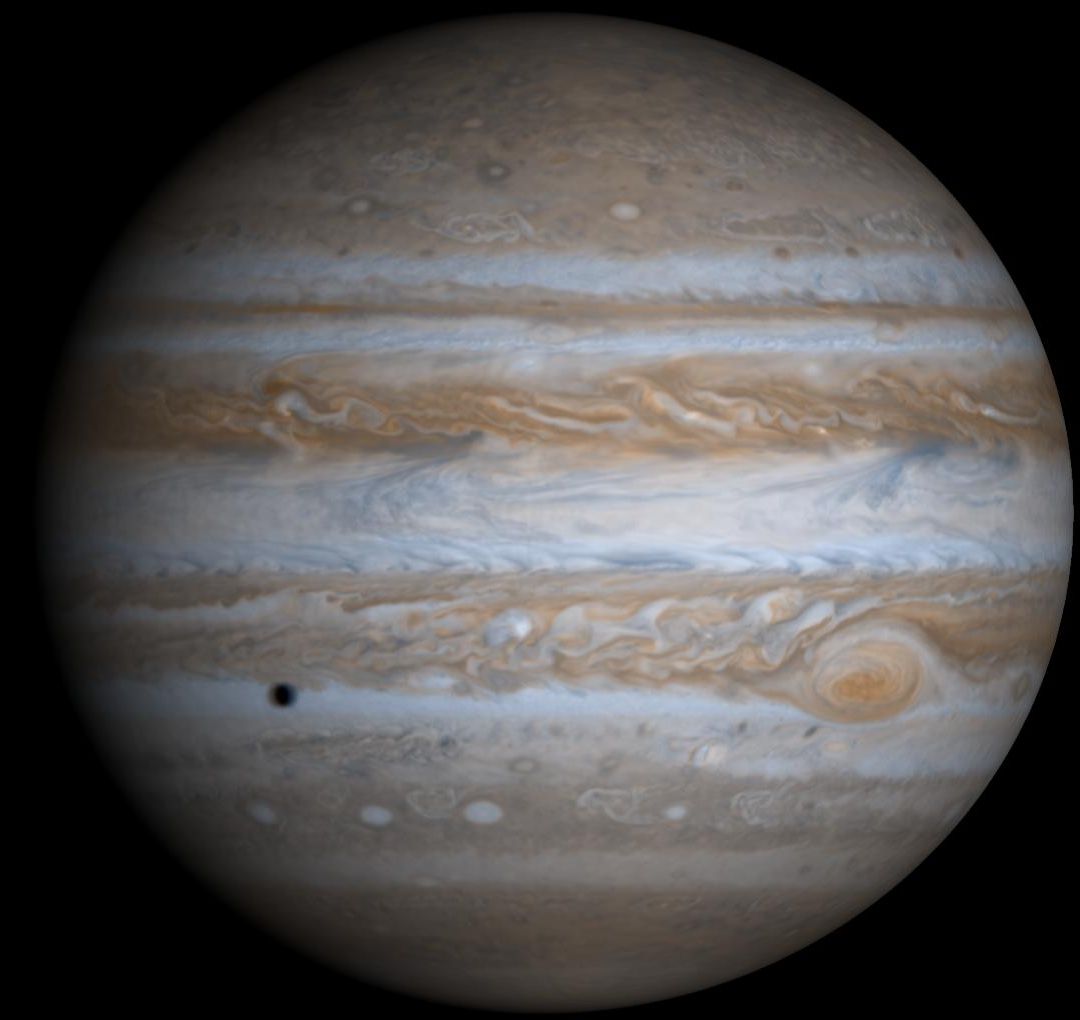
of the north's. On a faster-spinning planet such as Jupiter, the Coriolis effect
is much stronger and therefore the equator-to-pole tendency is broken up
into more cells. Each cloud band in this photo represents a cell:
An important thing to note about the Coriolis effect is that it does
not determine the direction of toilet flushes. Our experiment showed
that when traveling distances which are short compared to the diameter
of the merry-go-round, the ball is not noticeably deflected. Water
traveling a few inches from rim to center of a toilet ball is
traveling only a tiny, tiny fraction of the Earth's diameter, so the
Coriolis effect cannot be important. What is important is how water
is injected into the bowl.
I reinforced that idea by showing this video from a travel documentary,
whose producers and stars are completely taken in by locals living on the
equator purporting to demonstrate that water drains in different
directions just north of the equator vs just south of the equator. As
you watch this video, can you spot a major mistake the locals make?
Also, can you explain how the locals got the water to drain in
different directions at will?
In the next activity, we explored how the Coriolis effect also explains why storms like hurricanes circulate counterclockwise in the northern hemisphere and clockwise in the southern hemisphere.
Tuesday, March 12, 2013
Convection and Weather
This morning I guided the upper-graders at Peregrine School through a
set of weather-related activities.
First, we reviewed what we had learned previously about energy in the
Earth-Sun system. Briefly, although the Earth's core is very hot and
slowly cooling off due to heat flowing outward through the surface,
the vast majority of heat that we experience comes from the Sun. How
could we figure that out from everyday observations? Julia nailed it:
the surface temperature varies quite a bit from pole to equator and
from day to night, which is indicative of the Sun rather than of a
constant flow of heat outward in all directions from the Earth's core.
We also reviewed how the Sun heats the ground, not the air (because
air is transparent to visible light); air near the ground is heated by
the ground and that heat then gets mixed throughout the atmosphere.
Whenever something is heated from the bottom, as our atmosphere is,
you get convection (one of the three forms of heat transport we had
discussed earlier).
Convection is the reason we have weather. Hot air rises, cool air
sinks, and so air is always in motion. To assess the solidity of
their understanding of convection, I immersed a shot-glass full of hot
water (dyed red) into a big container of cool water (dyed ever so
slightly yellow to provide contrast), but first, I asked them to make
predictions about what would happen. This is a really nice, really
simple experiment or demo. You can see the hot fluid rising in wisps;
eventually all the red collects on the top half of the large
container. But the true test of understanding is predicting what
happens when I immerse a shot-glass full of cool water into a big
container of warm water. The kids showed a good understanding by
predicting that the cool water would not rise at all, and just stay in
the shot-glass (and the bit of cool water which might spill in the
process of setting the shot glass down in the large container would
also settle on the bottom of the large container). In weather, this
is called an inversion: if cold air gets under a layer of warm air, it
is trapped there, and among other things air pollution can build up in
a city where there's an inversion. (The Wikipedia article on inversion
has some decent pictures, and a Google image search on "weather
inversion" also yields some nice pics.)
Convection transports heat in the oceans as well as in the atmosphere.
There are ocean currents which circulate warm equatorial water toward
northern regions and bring cold water from the north back down toward
the equator to get warmed up again. The sea off California's coast is
rather cold because the current here comes from Alaska.
But the takeaway message of this part of the day (which took probably
only 20-25 minutes) is that the Sun provides the energy for moving air
around, which makes weather happen. Because of the way the Sun's
energy hits Earth, hot air must rise from equatorial regions and cold
air must sink near the poles. But the only way for this to be
sustainable is with a "conveyor belt": hot air which rises from
equatorial regions moves toward the poles, where it cools, sinks, and
moves along the surface back toward the equator. This creates wind
and weather patterns. Our next activity was designed to add more
nuance to this general idea.
Before proceeding to the next activity, I presented the class with a
lava lamp for long-term loan. This will constantly remind them of
convection even when I'm not there!
Subscribe to:
Posts (Atom)