Today was my last day with the 5-7 graders. We spent most of the time learning about beaches: how sand gets there and how sand moves once it's there (California grade 6 standard 2c). It's a lot more interesting than you might think, and it's explained well in this video. Normally I show just short clips of videos, 30 seconds or a minute here and there to support whatever I want to talk about; a lot of "educational" videos have a lot of fluff surrounding the critical part(s). But I found this video to be packed full of good visualizations of what's going on with beaches, far better than I could set up myself, and very little fluff. So we watched all 20 minutes (ok, I skipped the fluffy first 80 seconds), and I highly recommend it for parents too. Aside: It's from the 1960's, and told in the "voice of God" style strongly reminiscent of the films I was shown when I was in elementary school. Science videos today are quite different, typically with a friendly host just like us who wants to take part in experiments just like we do. That's probably an improvement on average, but I experienced some nostalgia for the "voice of God" style as I watched it.
After the video, I set the kids to work on the "Rollin' Down the Sand Highway" activity from this packet (the last activity in the packet). I didn't provide maps, but just looked them up online as needed. Some kids had never seen a topo map before, so I explained that in context. But for most of the time most of the kids were stuck on the math, which surprised me because the math is pretty simple. I guess it's a question of applying math outside of math class! It's always easier to apply a concept when you've just learned it and you know that the problem you've been given can be solved using that concept.
More specifically, the students did not have a clear idea of how to go about converting cubic yards of sand per year to dump trucks per minute. I led them through the easy step of converting cubic yards per year to dump trucks per year, and I thought this would give them the boost they needed to complete it on their own, but I was wrong. As I circulated around the room helping students, it came out that we would need to know how many minutes per year, and the students were able to come up with that number (although they may have Googled it on a mobile device behind my back): 525,600. But there was a huge amount of confusion regarding whether they multiply or divide by this number, and whether the result would be dump trucks per minute or minutes per dump truck. I walked them through how I think about it, and they stared at me totally lost; I stared back wondering how they could not have seen this before. So I backed up and (much wailing and gnashing of teeth omitted here) found a way to get it across.
Here's what worked: let's say that you are asked to compute 3 times 4, divided by 7 times 3:
3x4
---- = ?
7x3
The kids universally said the following: multiply across the top and also across the bottom:
3x4 12
---- = ---
7x3 21
This surprised me because it's not what I would do, but once I figured out that one kid was thinking like this, I repeated it for all the kids. Although the answer surprised me, it's not wrong, so let's continue along these lines and see what happens. The natural next step is to simplify the fraction 12/21: is this its simplest form? The typical answer from a student was: ...um...well, I don't see any common factors. And of course it's hard to see the common factors when you're staring at 12/21. But if instead you look at
3x4
---- =?
7x3
the common factor of 3 is jumping up and down screaming "I'm a common factor!" So cancel the 3's and you immediately get 4/7. This is not only much less work than writing 12/21 and then trying to simplify; it avoids the potential for a lot of mistakes. Although this kind of thing is second nature to me, it was not natural for the kids, who were intent on following the specific rules they had learned about multiplying fractions.
I had to go through all this just to get to the main idea: we can do the same kind of thing with items like dump trucks and minutes instead of specific numbers. We are given dump trucks per year and we want to get dump trucks per minute, so we can represent the problem like this:
dump trucks ? dump trucks
--------------- x -- = ---------------
year ? minute
We have to get rid of years and introduce minutes, so if we put years per minute in the question marks, we get:
dump trucks year dump trucks
--------------- x ----- = ---------------
year minute minute
The years on the left cancel each other, leaving dump trucks in the numerator and minutes in the denominator. If we had instead tried:
dump trucks minute dump trucks
--------------- x --------- = ---------------
year year minute
this equation is manifestly false; the right hand side should contain dump truck minutes on the top and years squared on the bottom. This kind of thinking seemed to be new to the 6th graders, and I'm glad I did it because it's really important. It provides a system for making sure you do the right thing. Don't know whether to multiply by 525,600 or divide by 525,600? One system popular among the students was to just try one approach, and then if the teacher says it's wrong, just do the other! But here's a system which makes clear that we have to multiply by years/minute, or 1/525600. And not sure if the resulting number represents dump trucks per minute or minutes per dump truck? Again, the system makes clear that the result is dump trucks per minute.
Another thing the kids need to internalize much better is sanity checking. If you multiply 722,222 cubic yards by the $5 per cubic yard it costs to remove, you should get a number bigger than 722,222, not less than 722,222. The kids didn't apply this kind of sanity checking to any of their results, and therefore didn't catch any of their mistakes before showing their answers to me. This was the first math-based activity I had really done with the upper-graders, and I was probably naive to expect that they could apply math outside the context of a math class. I should have given a little primer on how to estimate before calculating, how to check that your answer is right after calculating, etc. This is not really math; it's metacognition in a math context, and I'm now kicking myself for not emphasizing metacognition throughout this trimester with the upper graders.
In any case, we spent a lot of time on this activity: 1 hour, including the movie, before break; then maybe another 20 minutes after break. It was worth it to work through these issues, but then I did have to cut down on my planned post-break activity. I'll dedicate the next blog post to the humidity-related activities we did in the last 30 minutes of the morning.
Showing posts with label geology. Show all posts
Showing posts with label geology. Show all posts
Friday, March 29, 2013
Wednesday, February 27, 2013
The Dating Game
Our third activity last Friday was on radioisotope dating. (Everyone
has heard of carbon dating but carbon is just one of many radioactive
isotopes used for dating, and not even the most useful one for
geology, as we'll see below.) This tied in with the other two
activities, because a certain age pattern in seafloor rocks was a
prediction generated by students' model of continental motions. So
how do we measure the ages of rocks?
I prepared a whole bunch of small pieces of paper which were purple on
one side and white on the other. Each group got a handful and put
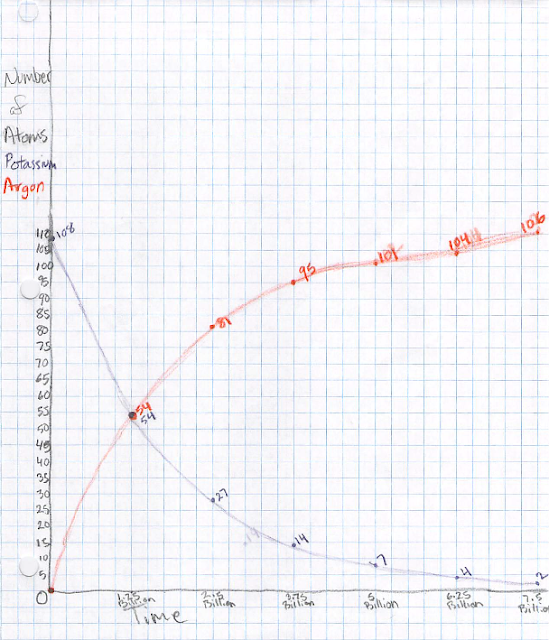
them all purple-side up. These represent potassium-40 atoms. Each
group started constructing a graph of the number of potassium-40 atoms
vs time. Let's say we start with 100 such atoms at a time we call
zero (we'll see later what this really means). Over 1.25 billion
years, half of the potassium-40 atoms decay into argon-40 atoms. The
students represent this by flipping over half of the "atoms" so the
white side is up. Once flipped over, it can never flip back. One
analogy is that once a ball rolls downhill, it's not going to roll
back up; similarly the argon-40 atom is in a lower-energy state. (The
word "decay" evokes an irreversible process, for good reason.) So now
the student plots 50 atoms at a time of 1.25 billion years. After
another 1.25 billion years, half of the remaining potassium-40 atoms
decay, so we now have 25 left and we plot that. We may also want to
keep track of the number of argon-40 atoms, so (in a different color
pencil) we put zero of those atoms at time zero, 50 at 1.25 billion
years, and 75 at 2.5 billion years.
Keep going with this process. In another time step, the 25
potassium-40 atoms decay into 12 or 13 argon-40 atoms. An atom can't
be half-decayed, and there is an element of randomness in this
process, so you can flip a coin or just decide randomly if it's 12 or
13. (Aficionados will recognize that there is some probability of 11
or 14 as well, but that's beyond the scope here.) Keep going until
you run out of graph paper, then connect the dots.
Now, how can we tell how old a rock is? Look at the ratio of potassium-40 to
argon-40 atoms: 1:0 at the start, 1:1 at t=1.25 billion years, 1:3
at 2.5 billion years, 1:7 at 3.75 billion years, etc. Measuring this
ratio provides an unambiguous estimate of the age of the rock. I had
the kids field a few practice questions where I would give an age and
they would give a ratio or percentage, or vice versa. (If you're more comfortable
with percentages, as a percentage of the total potassium-40+argon-40 atoms, it's
100% potassium-40 at the start, 50% at 1.25 billion years, 25% at 2.5 billion
years, 12.5% at 3.75 billion years, etc.)
But what do we mean by the "age" of a rock? This is really key to
understanding the whole thing. Argon is a gas, so when a rock is
molten the argon will just bubble out. So when a rock solidifies, it
has no argon atoms, and a 1:0 ratio of potassium-40 to argon-40 atoms.
So t=0 corresponds to the last time that the rock solidified, which is
exactly the tool we need to date the age of new ocean floor oozing out
of the mid-Atlantic ridge!
The half-life of potassium-40 is well suited to dating rocks because
so many of them are so old. What if we wanted to date something
younger, like a human skeleton from an archaeological dig? Even if it
was 4000 years old, the ratio of potassium-40 to argon-40 would be so
close to 1:0 that we wouldn't be able to tell. We need something with
a shorter half-life, like carbon-14, which decays to carbon-12 with a
half-life of only 5730 years. Carbon-14 is great for dating
skeletons, but if we tried to use it to date a rock, we would most
likely find zero carbon-14 left so we would only be able to say that
it's many half-lives old. To say that a rock is at least 10 of those
half-lives, or about 60,000 years old, is not very useful.
(Teacher warning: a lot of the implementation details are different
for carbon-14 dating. For instance, there is never a 1:0 ratio of
carbon-14 to carbon-12, not even close. So adapting this exercise to
carbon dating would be tricky.)
This was a good activity for the 25 minutes we had left. I wouldn't
try to squeeze this activity into any less time, but we definitely
could have used more time. For example, we could have plotted the
ratio; used our computer skills to make plots, including of the ratio;
brought in some algebra to calculate things quickly through an
equation rather than graphically; etc.
has heard of carbon dating but carbon is just one of many radioactive
isotopes used for dating, and not even the most useful one for
geology, as we'll see below.) This tied in with the other two
activities, because a certain age pattern in seafloor rocks was a
prediction generated by students' model of continental motions. So
how do we measure the ages of rocks?
I prepared a whole bunch of small pieces of paper which were purple on
one side and white on the other. Each group got a handful and put
them all purple-side up. These represent potassium-40 atoms. Each
group started constructing a graph of the number of potassium-40 atoms
vs time. Let's say we start with 100 such atoms at a time we call
zero (we'll see later what this really means). Over 1.25 billion
years, half of the potassium-40 atoms decay into argon-40 atoms. The
students represent this by flipping over half of the "atoms" so the
white side is up. Once flipped over, it can never flip back. One
analogy is that once a ball rolls downhill, it's not going to roll
back up; similarly the argon-40 atom is in a lower-energy state. (The
word "decay" evokes an irreversible process, for good reason.) So now
the student plots 50 atoms at a time of 1.25 billion years. After
another 1.25 billion years, half of the remaining potassium-40 atoms
decay, so we now have 25 left and we plot that. We may also want to
keep track of the number of argon-40 atoms, so (in a different color
pencil) we put zero of those atoms at time zero, 50 at 1.25 billion
years, and 75 at 2.5 billion years.
Keep going with this process. In another time step, the 25
potassium-40 atoms decay into 12 or 13 argon-40 atoms. An atom can't
be half-decayed, and there is an element of randomness in this
process, so you can flip a coin or just decide randomly if it's 12 or
13. (Aficionados will recognize that there is some probability of 11
or 14 as well, but that's beyond the scope here.) Keep going until
you run out of graph paper, then connect the dots.
Now, how can we tell how old a rock is? Look at the ratio of potassium-40 to
argon-40 atoms: 1:0 at the start, 1:1 at t=1.25 billion years, 1:3
at 2.5 billion years, 1:7 at 3.75 billion years, etc. Measuring this
ratio provides an unambiguous estimate of the age of the rock. I had
the kids field a few practice questions where I would give an age and
they would give a ratio or percentage, or vice versa. (If you're more comfortable
with percentages, as a percentage of the total potassium-40+argon-40 atoms, it's
100% potassium-40 at the start, 50% at 1.25 billion years, 25% at 2.5 billion
years, 12.5% at 3.75 billion years, etc.)

But what do we mean by the "age" of a rock? This is really key to
understanding the whole thing. Argon is a gas, so when a rock is
molten the argon will just bubble out. So when a rock solidifies, it
has no argon atoms, and a 1:0 ratio of potassium-40 to argon-40 atoms.
So t=0 corresponds to the last time that the rock solidified, which is
exactly the tool we need to date the age of new ocean floor oozing out
of the mid-Atlantic ridge!
The half-life of potassium-40 is well suited to dating rocks because
so many of them are so old. What if we wanted to date something
younger, like a human skeleton from an archaeological dig? Even if it
was 4000 years old, the ratio of potassium-40 to argon-40 would be so
close to 1:0 that we wouldn't be able to tell. We need something with
a shorter half-life, like carbon-14, which decays to carbon-12 with a
half-life of only 5730 years. Carbon-14 is great for dating
skeletons, but if we tried to use it to date a rock, we would most
likely find zero carbon-14 left so we would only be able to say that
it's many half-lives old. To say that a rock is at least 10 of those
half-lives, or about 60,000 years old, is not very useful.
(Teacher warning: a lot of the implementation details are different
for carbon-14 dating. For instance, there is never a 1:0 ratio of
carbon-14 to carbon-12, not even close. So adapting this exercise to
carbon dating would be tricky.)
This was a good activity for the 25 minutes we had left. I wouldn't
try to squeeze this activity into any less time, but we definitely
could have used more time. For example, we could have plotted the
ratio; used our computer skills to make plots, including of the ratio;
brought in some algebra to calculate things quickly through an
equation rather than graphically; etc.
Saturday, February 23, 2013
Trembling in our Books
Yesterday we did three activities related to plate tectonics: making a
model of continental motion and generating predictions from it;
locating earthquakes; and radioisotope dating of rocks. The second
activity followed roughly the reasoning outlined here. However, I
didn't want to get into S and P waves, so instead of measuring the
distance from the epicenter to the seismograph by analyzing the wave
form, I decided to "simplify" and give students the time of arrival at
the three seismographs. Only after we started the activity did I
realize that although the timing information I gave was sufficient,
some serious algebra would be required to solve the problem with just
that information. So I ended up giving them the distance from the
earthquake to one of the seismographs, just to get them started.
Using timing information to solve for a location is an important
problem with many real-world aspects. For example, GPS uses exactly
the kind of reasoning shown in the last figure of the page linked to
above, but in full 3-d with satellites distributed around the Earth,
to solve for your full 3-d location. So I like the pure-timing aspect
of my version of the activity, but I have to find a way to make
workable for 5-7 graders.
Still, I don't think the kids noticed all this scrambling going on
behind the scenes. They got the main ideas: the intersections of two
circles are the candidate epicenters based on two seismographs, and a
third seismograph can be used to resolve the ambiguity. And they had
fun finding the mystery location of the epicenter. I think we took
about 40 minutes on this activity, including a 5-minute opening
discussion on the link between earthquakes and our previous activity.
Get My Drift?
Yesterday we did three activities related to plate tectonics: making a
model of continental motion and generating predictions from it;
locating earthquakes; and radioisotope dating of rocks.
In the first activity, I gave students cutouts of the continents.
(The best way to find these is by googling terms related to this
activity; you can't just print a world map because of the distortion
inherent in most projections.) The cutouts were on their desks as the
students filed in, so it was interesting to see what the students did
without any instructions: mostly arrange them as they are now rather
than try to put them together like a puzzle. But it only took a small
hint to get them assembling the puzzle. Once each group settled on a
way of fitting the continents together, I had them glue the model to
one side of a handout I had prepared. On the other side they were
instructed to make four specific predictions about what would be
observable if this model were true. I had to drop some major hints,
but the groups did eventually come up with the same four major
categories: (1) fossils on once-adjacent pieces of land should be the
same even though they are now very far apart; (2) living creatures on
once-adjacent pieces of land should be similar (making allowance for
evolutionary changes and for especially mobile animals such as birds
to be excluded from this analysis; (3) an expanding ocean floor should
be young in the middle where it spreads apart, and progressively older
near the continents (some groups put more emphasis on finding an
identifiable mid-ocean feature, but it's basically the same idea); (4)
once-adjacent pieces of land should have very similar older rock
layers even though they are now very far apart. One thing no one got
even though I mentioned GPS is that we should be able to measure the
distance between, say, North America and Europe increasing very
slightly each year (it is, by a few centimeters per year).
I had planned for this to be iterative. In my original plan the
groups were to make a very specific prediction such as "fossils found
in this part of Antarctica match the fossils in this part of
Australia", and then I would look that up quickly (to prevent
computers from being a distraction), and then after seeing how all
four predictions went they would make a better model on a new sheet of
paper (I brought lots of continent cutouts). But the initial puzzle
assembling took much, much longer than I anticipated. Some groups
took a lot of time to trim their rough-cut continent cutouts in
exquisite detail; others rearranged theirs many times; others just
didn't focus as much as I would have liked. So we didn't go through
another iteration. But one lesson that was clear to me at least is
that although South America fits nicely into Africa, almost nothing
else matches that clearly. At some point you have to guess (this is
clear when comparing the different guesses of the different groups),
and at that point you have to look for fossil evidence to verify or
falsify your guess. That whole process is what science is really all
about!
In the time left before break, I asked the students to guess why the
continents move. They had a lot of crazy theories, but I steered it
back to what we had learned last week: the core of the Earth is hot,
heat flows to areas of lower temperature, and it can flow through
radiation, conduction, and/or convection. We talked about how each of
these might or might not apply in this case, and figured out that
convection is well suited to transporting heat through the mantle,
which is fluid although not really molten. Once we got this all into
a diagram with convection loops in the mantle, it was clear that this
was a very plausible mechanism for making continents move.
This whole activity took 45 minutes, and as I mentioned I probably
should have budgeted much longer, and/or come up with ways to save
lots of time on the puzzle-assembly. Devoting time to verify or
falsify specific predictions and come up with a better model would
have been a great illustration of the process of science. Maybe it
should be a homework. But, apart from this reservation, I think it's
a great activity.
Friday, December 14, 2012
Origins Part I
Teacher Pa's class as been studying various religions, including their
creation stories, this week, so she asked me to review the scientific
"creation story" with the kids. She had made a big poster with
Hinduism, Judaism, Christianity, and Islam as column headings, each
with entries in rows titled [Name of] God, [Sacred] Book, Creation
Story, Golden Rule, What Happens After Death, and Holidays, and she
wanted me to fill in a Science column for Creation Story, Golden Rule,
and What Happens After Death.
I wanted to make very, VERY clear to the kids that science is not
another religion, so I refused to tell a "creation story" and instead
made a detective story about our origins. (It turns out I was
justified: even after spending the whole morning with the kids and
emphasizing how science works, as the kids went to lunch I began
ripping the Science column off the religion poster and my own son
Linus said, "Dad, what holidays does science celebrate?")
I started the morning by discussing what kinds of questions science
can answer and what kinds of questions it can't. If you're about to
bite into your last cookie and someone asks you to share it, can
science help you figure out if you should share it? No. If your best
friend moves away and you're lonely, can science help you figure out
what to do? No. Religion might help you with those questions. But
if you have a question about nature, such as "When did the Earth
begin?", then science can help. I think it's super-important to help
kids draw these distinctions. Because religion tries to say something
about our origins, and so does science, it's tempting to make
parallels between them. But the differences are more important then
the superficial parallels, and we need to help kids see that. Science
and religion are simply about different things. If we had a poster
comparing different sports, we wouldn't put Sudoku on it!
The kids had done a timeline of the history of Davis, so I started
with a blank timeline with "Now" on the right and "?" on the left. I
put a few recent events (the years they were born) close to "Now" and
asked how we could know about the distant past using evidence (clues).
Because they had recently been to Yosemite and seen a slice of a tree
with about 1,000 rings, I started with that: we know that trees grow
one ring each year, so this tree tells us that Earth is at least 1,000
years old. In fact, the oldest trees in the world live in California
and they are over 4,000 years old, so I marked that too. (Aside: by
matching long-dead trees with just-felled trees [using ring thickness
as an indicator of how good for growth each year was], scientists have
been able to put together tree-ring histories going back about 10,000
years!)
Next, we moved on to rocks. They had studied some geology in
preparation for Yosemite, so we reviewed how long it takes millions of
years for a river to carve a canyon, based on how fast we observe it
carving today. So Earth is at least millions of years old. One kid
knew that some rocks are at least 1,000,000,000 (one billion...I wrote
out the number to impress them) years old. But how, I asked.
"Dating." OK, but how do we do that? I did a very simplified version
of radioisotope dating. I took some dominoes and stood them up on a
desk. Standing up, they have some potential energy, because they have
the potential to fall. Once fallen, they don't have potential energy.
(We had talked a bit about this concept previously.) Now some atoms
in your bones (or in rocks) have this extra potential energy, but as
time goes on more and more of them lose this. I knocked down a few to
illustrate the passage of some time, then a few more to illustrate the
passage of more time, etc. They quickly got the idea of "more down
equals older" (I gave them many scenarios and they got the relative
ages right) but I'm not sure what they were really visualizing when we
said "more energy" or "fall down" because I got questions about
whether the atoms are dead or had changed into something else. A nice
thing about these dominoes was that they came in different colors, so
it was easy to point out that this domino is still a red domino with 5
and 2 dots, it's just that it doesn't have extra energy now. So I
think the got the idea that we were using small particles in the rocks
as a clock, but not much else. Which is probably ok; you can't do
everything. (If I had planned this whole semester better I probably
would have brought in a microscope very early on, and established the
concept of atoms so that I could safely refer to it throughout the
semester...last year all the kids in the school studied atoms but only
one of those kids is in this room this year.)
So I extended the timeline all the way across the other (very long)
whiteboard and wrote 4,500,000,000 as the age of the oldest rocks on
Earth. I then mentioned meteors, which they had heard of, and how
their slamming together would generate heat. (I slammed clay lumps
together for visual effect.) We think Earth was formed by meteors
slamming together and creating so much heat that they melted together.
The rock-dating clock starts when the rock solidifies, so the age of
the Earth is 4,500,000,000 years. I then wanted to show them a movie
rendering of this process, and I showed the first few minutes of the
Birth of the Earth episode of How the Earth Was Made; in the first
several minutes they have some really nice visualizations of this.
But they like it so much that we kept watching, well into break time,
and almost finished. But with about 10 minutes left in the 43-minute
episode, I really wanted them to stretch their legs so we encourage
them to go outside but left the option of continuing to watch. Half
the kids watched to the end. I highly recommend this episode, and in
fact this whole series. It emphasizes the use of evidence to test
ideas.
The kids had MANY questions in response to the video. It was great to click Pause as soon as a question arose so I could deal with it right away. I felt like the movie was an awesome way to keep their attention (which is sometimes a struggle), but I could still provide an interactive teaching environment. It was the best of both worlds.
I have a lot more to say about what we did after break, but I'll make
that another post. To be continued....
Friday, October 26, 2012
Balance, and floating vs sinking
Today in the 1-2 grade room we had a blast with some of the ideas we
need to use in making the water feature.
First, balance. I brought in two-meter-long sticks on pivots, along
with sets of weights of various sizes, and had the kids hang weights
in different places and then see where they had to place other weights
to balance it out. They quickly discovered that a small weight can
balance a large one, IF it is placed at the end of a long arm. This
was a really good exercise because, in contrast to some of our
previous ones, I had enough equipment for each child to explore
completely on his/her own.
The pre-snack period culminated with two capstone events:
(1) I gave the kids a worksheet in which I drew balance beams
with a weight on one side (varying the size and position of the
weight), and they had to draw the weight (size and position) they
would put on the other side. Mostly they got it right, and in the few
cases where there was confusion we had the equipment right there to
check if their drawing represented reality. (2) I demonstrated how
balance facilitates rotation. You can see a video I made about this
demo at the end of this blog post from last year. As kids went to break,
some of them commented how this demo is like the Moon going around the
Earth, and asking whether the Earth wobbles a little as it does so.
The answer is yes, and so does the Sun as the planets (Jupiter has the
biggest effect) go around it. Therefore, if you saw a star which was
wobbling, what could you conclude about it? Right, it has planets!
This is really how astronomers do it; the vast majority of planets are
too faint to see directly given the glare of their host stars.
Post-snack, we switched to fluid mechanics. We started by reviewing
what we learned about pressure last time, focusing on why water
doesn't fall from a straw when you cover the top with your finger. I
then showed the same idea in slightly different form: with two 2-liter
soda bottles screwed together, water does NOT fall from the top one to
the bottom one (it may drip, but it doesn't make the waterfall you
might expect in an open-bottle situation). The water doesn't fall
because for the water to go down, the air in the bottom bottle has to
move up, and the two get in each other's way. We then figured out how
to make them not get in each other's way: swirl it to make a "tornado
in a bottle." The air goes up through the middle while the water
swirls down around the outside.
We then took some time for each kid to make his/her own tornado in a
bottle, with the option of coloring and/or glittering the water. This
was great fun; the kids were really into it and came up with some
pretty (and/or Halloweeny) combinations.
Next, we studied floating and sinking, following more or less the
script from one of my Primaria sessions last year (adding a bit of
sophistication such as introducing the word density). But we had time
only to get to the egg in the salt water. We'll do the rest next time.
At the last minute, we stumbled into a nice connection between the egg
and geology. Teacher Pa said that the way to tell if an egg has gone
bad is to see if it floats (in non-salted water). Linus had said just
5-10 minutes before that pumice is a rock that floats because it has
lots of gas bubbles in it. So the connection is that an egg which
floats (without the help of salt) probably has gas bubbles in it,
which clearly is a sign that it's going bad.
Saturday, September 22, 2012
Glaciers, Plate Tectonics, Rock Cycle and Fossils: The Geology and Yosemite
Friday was jam-packed with science this week as Teacher Carol and I
helped the upper graders demonstrate the geology of Yosemite to the
younger children, in preparation for our field trip there. I stayed
in the 1-2 grade classroom, so I will mostly report from there.
Carol set up four half-hour activities:
topic with the aid of posters they had made (you can read more about
Carol's work preparing the upper graders on her blog). The upper
graders knew their stuff but had not been trained in pedagogy, so
Teacher Marcia and I facilitated by asking questions and repeating
explanations with simpler words and examples when necessary. (Teacher
Marcia was really excellent in this regard! At some point after
discussing erosion, the movement of rocks came up again and instead of
assuming the students instantly made the connection to erosion, she
asked "Do rocks have legs?" This was funny but also made the children
stop and make connections to what they had learned earlier.) Then
each topic turned to a related hands-on activity or demonstration:
Glaciers: we went outside as the upper grades made a block of ice
slide down a "mountain" of sand in the sandbox. The kids sketched it,
then returned in the afternoon to sketch it after the glacier melted.
The point was to observe the pile of soil and rock left at the point
of the glacier's farthest advance. We will see moraines like this in
Yosemite. Often, they serve as dams for rivers which form in the
channel left by the glacier, and thus have lakes right behind them.
This phenomenon of course wasn't visible in the sandbox demo but I
wonder if we could tweak the demo next time so that it is.
Structure of the Earth and plate tectonics: we used a hard-boiled egg
to demonstrate a really thin crust (the shell) over a mantle (the
white) and a core (the yolk). The Earth's crust really is that thin
relative to its bulk! Slicing the egg in half also fractured the
shell into "tectonic plates." We further demonstrated different ways
in which plates interact at their edges (convergent, divergent, and
transform boundaries) with pieces of cardboard, paper, and our hands.
The rock cycle: we grated crayons to represent erosion, then we
deposited the grains into a riverbed of aluminum foil. We did this
for a few different colors to make distinctive layers of sedimentary
rock, then we wrapped up the foil and added pressure (with kids'
hands) and heat (with a torch). When we opened the foil we found
metamorphic rock! The torch was my idea because kids love flame, but
it melted the outside without melting the inside, so I would recommend
Carol's original suggestion of a hot-water bath to supply the heat.
Making fossils: we transitioned from the rock cycle to this by
discussing how older layers of rock are deposited first and buried
further down, so we can relate the rock layers to the ages of fossils.
The 1-2 graders are really into dinosaurs, so this was a great
transition: training for dinosaur hunters. Beforehand, Carol and I
half-filled small paper cups with clay and coated the flat top of the
clay with a bit of Vaseline. The kids chose from a selection of
animal figurines and pressed their animal into the clay. They removed
the animal to simulate the decay of the flesh, but the imprint
remained. Then a mudslide came along (me pouring wet plaster from a
large cup) and buried the imprint. They took the cups home and
excavated their fossils the next day.
It seemed like a great experience for the kids, but it would also have
been great if it had been a little more spread out, say over two
Friday mornings. We were asking the 1-2 graders to absorb a lot of
information in one morning! Teacher Marcia found a good way of
spreading it out after the fact: Carol provided worksheets for the
kids to fill out, but we didn't have time for that because we had to
go slower for the 1-2 graders, so Marcia decided she will use them to
reinforce and review over the next week. Apparently the 3-4 graders
were able to complete their worksheets in the morning.
The upper graders certainly learned a lot in the week leading up to
this Friday, first learning from Carol (with the worksheets asking
them to articulate their knowledge), and then making posters and
rehearsing demonstrations to prepare for teaching the lower graders.
(If you want to read more about Carol's work with the upper graders,
see her blog.) However, because the upper graders had no training in
instructive strategies (asking questions, asking students to come up
with additional examples, etc), the teachers in the room had to
intervene a lot (Carol confirmed that this happened in the 3-4 grade
room too) and by the end the upper graders had become somewhat
passive. I wonder if we could improve this next time by asking the
upper graders to fill a more specific role rather than a general one,
for example each doing a certain experiment or demo which was
self-contained enough for them to feel expert in. They were certainly
good in helping the kids one-on-one, for example in making the fossils
and, in the 3-4 grade room, in responding to questions asked by the
worksheets.
helped the upper graders demonstrate the geology of Yosemite to the
younger children, in preparation for our field trip there. I stayed
in the 1-2 grade classroom, so I will mostly report from there.
Carol set up four half-hour activities:
- glaciers
- structure of the Earth (crust, mantle, core) and plate tectonics
- [snack/recess]
- the rock cycle
- making fossils
topic with the aid of posters they had made (you can read more about
Carol's work preparing the upper graders on her blog). The upper
graders knew their stuff but had not been trained in pedagogy, so
Teacher Marcia and I facilitated by asking questions and repeating
explanations with simpler words and examples when necessary. (Teacher
Marcia was really excellent in this regard! At some point after
discussing erosion, the movement of rocks came up again and instead of
assuming the students instantly made the connection to erosion, she
asked "Do rocks have legs?" This was funny but also made the children
stop and make connections to what they had learned earlier.) Then
each topic turned to a related hands-on activity or demonstration:
Glaciers: we went outside as the upper grades made a block of ice
slide down a "mountain" of sand in the sandbox. The kids sketched it,
then returned in the afternoon to sketch it after the glacier melted.
The point was to observe the pile of soil and rock left at the point
of the glacier's farthest advance. We will see moraines like this in
Yosemite. Often, they serve as dams for rivers which form in the
channel left by the glacier, and thus have lakes right behind them.
This phenomenon of course wasn't visible in the sandbox demo but I
wonder if we could tweak the demo next time so that it is.
Structure of the Earth and plate tectonics: we used a hard-boiled egg
to demonstrate a really thin crust (the shell) over a mantle (the
white) and a core (the yolk). The Earth's crust really is that thin
relative to its bulk! Slicing the egg in half also fractured the
shell into "tectonic plates." We further demonstrated different ways
in which plates interact at their edges (convergent, divergent, and
transform boundaries) with pieces of cardboard, paper, and our hands.
The rock cycle: we grated crayons to represent erosion, then we
deposited the grains into a riverbed of aluminum foil. We did this
for a few different colors to make distinctive layers of sedimentary
rock, then we wrapped up the foil and added pressure (with kids'
hands) and heat (with a torch). When we opened the foil we found
metamorphic rock! The torch was my idea because kids love flame, but
it melted the outside without melting the inside, so I would recommend
Carol's original suggestion of a hot-water bath to supply the heat.
Making fossils: we transitioned from the rock cycle to this by
discussing how older layers of rock are deposited first and buried
further down, so we can relate the rock layers to the ages of fossils.
The 1-2 graders are really into dinosaurs, so this was a great
transition: training for dinosaur hunters. Beforehand, Carol and I
half-filled small paper cups with clay and coated the flat top of the
clay with a bit of Vaseline. The kids chose from a selection of
animal figurines and pressed their animal into the clay. They removed
the animal to simulate the decay of the flesh, but the imprint
remained. Then a mudslide came along (me pouring wet plaster from a
large cup) and buried the imprint. They took the cups home and
excavated their fossils the next day.
It seemed like a great experience for the kids, but it would also have
been great if it had been a little more spread out, say over two
Friday mornings. We were asking the 1-2 graders to absorb a lot of
information in one morning! Teacher Marcia found a good way of
spreading it out after the fact: Carol provided worksheets for the
kids to fill out, but we didn't have time for that because we had to
go slower for the 1-2 graders, so Marcia decided she will use them to
reinforce and review over the next week. Apparently the 3-4 graders
were able to complete their worksheets in the morning.
The upper graders certainly learned a lot in the week leading up to
this Friday, first learning from Carol (with the worksheets asking
them to articulate their knowledge), and then making posters and
rehearsing demonstrations to prepare for teaching the lower graders.
(If you want to read more about Carol's work with the upper graders,
see her blog.) However, because the upper graders had no training in
instructive strategies (asking questions, asking students to come up
with additional examples, etc), the teachers in the room had to
intervene a lot (Carol confirmed that this happened in the 3-4 grade
room too) and by the end the upper graders had become somewhat
passive. I wonder if we could improve this next time by asking the
upper graders to fill a more specific role rather than a general one,
for example each doing a certain experiment or demo which was
self-contained enough for them to feel expert in. They were certainly
good in helping the kids one-on-one, for example in making the fossils
and, in the 3-4 grade room, in responding to questions asked by the
worksheets.
Monday, April 9, 2012
Dinosaur layer cake
Some of the boys in Primaria are really into dinosaurs and have been
asking for a dinosaur-related experiment. By talking to them on
previous visits, I got a sense of what would be useful. They knew
that dinosaurs did not live at the same time as cavemen, but they
didn't know how we know that. Understanding this brings together a
lot of key ideas in geology and in scientific reasoning, so I thought
it would make a great activity. But it turned out to be more of a
demo than a small-group activity, so it fit the schedule well on a day
when there was less time for science due to the Easter egg hunt.
I brought a large, clear plastic box and set it on a table in the
outdoor area. As part of the setup I also filled some buckets with
different materials in the yard: sand, wood chips, and black dirt from
the planter boxes. I started, as usual, by asking them what they know
about the topic, and I tried to steer the resulting conversation
toward how they know what they know. (Aside: this is one of the few
times I had a conversation with the entire class of 20+ kids at once,
and it was surprisingly not chaotic. It really helped to have them
seated before the start, with everyone able to see because I was on a
platform.) One boy was able to give an answer like "men hadn't
evolved yet" but no one know how we know that. So that provided the
motivation for the following demo.
As part of the preparation, I had also printed out skeletons of
different dinosaurs as well as Lucy and a modern human, and glued
these to pieces of cardboard. I pulled out the stegosaurus and asked,
"Who knows what this is?" Then we imagined stegosaurus caught in a
mudslide. I had a volunteer help me pour the bucket of sand over the
stegosaurus (in the large clear plastic box). Then, some time later,
here comes a...does anyone know what this is? Triceratops.
Triceratops dies and gets buried in a layer of wood chips, symbolizing
a different type of soil in that area at that time, which ultimately
forms a different layer of rock. We repeated with a T. Rex and
another layer of sand.
Then we imagined that the area was underwater for a time. We talked
about how an area could be underwater at times and above water at
other times. We reviewed what they had learned about rivers and the
water cycle, and decided that layers of sediment can build up on the
lake's bottom or the sea floor. We also related it to what they had
learned about the deep ocean, that things (like whale bones and
smaller bits of nutrients) rain down from above. We simulated this by
having a few volunteers rain down black dirt, while I dropped an
elasmosaurus skeleton in.
Next, I did a special, thin, brightly colored layer using a bottle of
paprika. They guessed it represented lava but I said we would come
back to discuss it later.
Then I brought out Lucy and discussed her, buried her in another layer
of wood chips and then brought out the modern human skeleton and
buried him in a final layer of sand. The final product was
impressive, clearly showing seven different layers of "rock" through
the clear plastic. (The box was about 2.5 feet long by 1.5 wide by
1.5 feet deep, and was about 2/3 filled by the end.) We discussed how
the oldest rock layers are on the bottom and the newest are on the
top, so that the fossils we find on the bottom layers are of creatures
who lived long ago, and the fossils we find on the top layers are of
creatures who lived recently. (This is true even if an earthquake
comes later and tilts the layers. I tilted the box and asked who had
been to the Grand Canyon and seen the tilted layers there; a
substantial minority had seen it.) Do we ever find cavemen (Lucy) on
the bottom layers? No. Do we ever find dinosaurs on the top layers?
No. We can even tell which dinosaurs lived earlier, and which lived
later.
Next, I had them exercise their hypothetico-deductive reasoning
skills. If Lucy had lived as early as the dinosaurs, what would we
find? If the dinosaurs had lived as late as Lucy, what would we find?
Finally, I returned to the thin paprika band. All over the world, we
find an easily identifiable band called the K-T boundary, and we find
dinosaur fossils only below that band, indicating that dinosaurs died
out around the time the band was formed. And the band has been found
to contain an element, iridium, in much higher concentrations than
normally found on Earth, but consistent with a certain type of
asteroid. The conclusion is that an asteroid impact and its aftermath
killed the dinosaurs.
I'm aware that this model is not universally accepted; some scientists
think volcanism played a role in the demise of the dinosaurs, and some
think the dinosaurs were dying out before the asteroid impact, which
perhaps only delivered the coup de grace. But there's only so much
detail you can go into with five-year-olds. The best thing I can do
to help them deal with nuance as they grow more sophisticated is to
give them practice reasoning with evidence, just as I did.
I left the whole layer cake for the kids to excavate in their free time after lunch.
I had originally envisioned doing something which would make the layers set more
like stone so they would really have to chip away at it, but after finding out that
plaster of paris is toxic, decided not to go there. I suppose a weak concrete might work,
and I may return to this idea in future years. If I had done plaster or concrete, I would
have found something to color the layers slightly so they would show a bit of contrast.
As it happened, the sand/woodchips/black dirt made a beautiful set of layers.
I highly recommend reading this story of how Walter Alvarez and collaborators figured out the K-T boundary. It really shows how
science works; it involves far more creativity and discovery than most
students are led to believe by being forced to do contrived lab
exercises in school. Unfortunately, many K12 teachers have
experienced science only in that contrived, uninteresting context, and
themselves do not believe science requires creativity, and therefore
create a vicious cycle when they pass that attitude on to their
students. I'll sign off with this link to a list of misconceptions about science.
Subscribe to:
Posts (Atom)