After spending most of the morning studying the dynamics of sand along California's beaches, I had about 30 minutes left to tie up some loose ends I had left on my last visit. On that visit, I had promised that I could catastrophically crush an aluminum soda can using just heat and cold, but it didn't work. As soon as I left the school that day, I realized what I had done wrong, but instead of just explaining what I did wrong, I planned some activities to build up to an explanation. The first was measuring the dew point in the room. (Note: there are lots of dew-point activities written up on the web; I'm just linking to a random one here out of laziness. In particular, I saved time compared to the activity in this link by starting with cool rather than warm water.) The dew point was about 10 C, in a room with a temperature of about 20 C. I also had them answer some questions related to dew point, such as: Which city would you rather travel to, one where the dew point is 50 F or one where it is 80 F? Explain why, and suggest a plausible location for each city.
Then we related dew point to relative humidity. I wanted to make a graph of amount of water that air holds, vs temperature of the air. At any temperature, there is a maximum amount it can hold, so I can sketch this maximum amount as a curve which changes with temperature. I elicited from them how I should sketch it: the warmer the air, the more water it can hold. On that same graph, how would we represent the air in this room? We know it's 20 C, and we know the amount of water in the air is substantially less than the maximum---if it were close to the max we would have seen condensation very quickly as soon as we began to cool the glass. So I made a mark indicating that conceptually. As we cooled the glass, we lowered its temp, so I drew a line going leftward from that point. When it hits the max curve, it condenses.
So the dew point is an indication of how much water is in the air, but what we feel as humidity is really how much water is in the air relative to the maximum it could hold at that temperature. This is called relative humidity. For example, the dew point was about 10 C, or about 50 F, and in a 70 F room that doesn't feel humid. But in a 52 F room, that would feel clammy as well as cool. So I asked the kids to brainstorm how they could build a device to measure relative humidity. To my surprise (because I was hearing some whining) someone came up really quickly with the idea of a wet thermometer. I said "Brilliant!" and tried to elicit more details. Why is being wet important? Because then there will be evaporation. OK, how will evaporation change your thermometer reading? There was much discussion of this, with about half the class leaning toward warmer and half toward colder, but eventually I steered them toward thinking about getting out of a swimming pool and feeling cold as all those little water drops on your skin evaporate. The thermometer will definitely read a colder temperature! So how does this help you determine humidity? Well, if the air is very humid already, there won't be much evaporation, so the wet thermometer won't read much colder than a dry thermometer. If the air is very dry, there will be a lot of evaporation and the wet thermometer will read much colder than a dry thermometer. So we did the experiment, and we found about 16 C (61 F) for the wet one and 20 C (70 F) for the dry one. Then we find a table which tells us the relative humidity as a function of dry-bulb temp and the temperature difference between dry and wet bulbs.
Now for the grand finale. I reminded them how much a substance expands when going from liquid to gas. Similarly, when a gas condenses to liquid, it occupies much less volume. So I put a small amount of water into an empty aluminum soda can, heat the can with a torch so that the gas in the can is mostly water vapor, then plunge the can upside-down into an ice bath. The water vapor in the can condenses quickly. Suddenly, there's a lot of empty space in the can, and it collapses catastrophically because the pressure on the outside of the can (standard atmospheric pressure) is so much greater than the pressure on the outside of the can (very little because the gas is gone). When I tried to do this demo previously, I was not cognizant of the key role of condensation and I put very little ice into a giant pail of water, virtually guaranteeing that I would not get condensation. You can see a video of this kind of demo here. It was a satisfying conclusion. Three kids wanted to take crushed cans home for keepsakes.
Friday, March 29, 2013
A River of Sand
Today was my last day with the 5-7 graders. We spent most of the time learning about beaches: how sand gets there and how sand moves once it's there (California grade 6 standard 2c). It's a lot more interesting than you might think, and it's explained well in this video. Normally I show just short clips of videos, 30 seconds or a minute here and there to support whatever I want to talk about; a lot of "educational" videos have a lot of fluff surrounding the critical part(s). But I found this video to be packed full of good visualizations of what's going on with beaches, far better than I could set up myself, and very little fluff. So we watched all 20 minutes (ok, I skipped the fluffy first 80 seconds), and I highly recommend it for parents too. Aside: It's from the 1960's, and told in the "voice of God" style strongly reminiscent of the films I was shown when I was in elementary school. Science videos today are quite different, typically with a friendly host just like us who wants to take part in experiments just like we do. That's probably an improvement on average, but I experienced some nostalgia for the "voice of God" style as I watched it.
After the video, I set the kids to work on the "Rollin' Down the Sand Highway" activity from this packet (the last activity in the packet). I didn't provide maps, but just looked them up online as needed. Some kids had never seen a topo map before, so I explained that in context. But for most of the time most of the kids were stuck on the math, which surprised me because the math is pretty simple. I guess it's a question of applying math outside of math class! It's always easier to apply a concept when you've just learned it and you know that the problem you've been given can be solved using that concept.
More specifically, the students did not have a clear idea of how to go about converting cubic yards of sand per year to dump trucks per minute. I led them through the easy step of converting cubic yards per year to dump trucks per year, and I thought this would give them the boost they needed to complete it on their own, but I was wrong. As I circulated around the room helping students, it came out that we would need to know how many minutes per year, and the students were able to come up with that number (although they may have Googled it on a mobile device behind my back): 525,600. But there was a huge amount of confusion regarding whether they multiply or divide by this number, and whether the result would be dump trucks per minute or minutes per dump truck. I walked them through how I think about it, and they stared at me totally lost; I stared back wondering how they could not have seen this before. So I backed up and (much wailing and gnashing of teeth omitted here) found a way to get it across.
Here's what worked: let's say that you are asked to compute 3 times 4, divided by 7 times 3:
3x4
---- = ?
7x3
The kids universally said the following: multiply across the top and also across the bottom:
3x4 12
---- = ---
7x3 21
This surprised me because it's not what I would do, but once I figured out that one kid was thinking like this, I repeated it for all the kids. Although the answer surprised me, it's not wrong, so let's continue along these lines and see what happens. The natural next step is to simplify the fraction 12/21: is this its simplest form? The typical answer from a student was: ...um...well, I don't see any common factors. And of course it's hard to see the common factors when you're staring at 12/21. But if instead you look at
3x4
---- =?
7x3
the common factor of 3 is jumping up and down screaming "I'm a common factor!" So cancel the 3's and you immediately get 4/7. This is not only much less work than writing 12/21 and then trying to simplify; it avoids the potential for a lot of mistakes. Although this kind of thing is second nature to me, it was not natural for the kids, who were intent on following the specific rules they had learned about multiplying fractions.
I had to go through all this just to get to the main idea: we can do the same kind of thing with items like dump trucks and minutes instead of specific numbers. We are given dump trucks per year and we want to get dump trucks per minute, so we can represent the problem like this:
dump trucks ? dump trucks
--------------- x -- = ---------------
year ? minute
We have to get rid of years and introduce minutes, so if we put years per minute in the question marks, we get:
dump trucks year dump trucks
--------------- x ----- = ---------------
year minute minute
The years on the left cancel each other, leaving dump trucks in the numerator and minutes in the denominator. If we had instead tried:
dump trucks minute dump trucks
--------------- x --------- = ---------------
year year minute
this equation is manifestly false; the right hand side should contain dump truck minutes on the top and years squared on the bottom. This kind of thinking seemed to be new to the 6th graders, and I'm glad I did it because it's really important. It provides a system for making sure you do the right thing. Don't know whether to multiply by 525,600 or divide by 525,600? One system popular among the students was to just try one approach, and then if the teacher says it's wrong, just do the other! But here's a system which makes clear that we have to multiply by years/minute, or 1/525600. And not sure if the resulting number represents dump trucks per minute or minutes per dump truck? Again, the system makes clear that the result is dump trucks per minute.
Another thing the kids need to internalize much better is sanity checking. If you multiply 722,222 cubic yards by the $5 per cubic yard it costs to remove, you should get a number bigger than 722,222, not less than 722,222. The kids didn't apply this kind of sanity checking to any of their results, and therefore didn't catch any of their mistakes before showing their answers to me. This was the first math-based activity I had really done with the upper-graders, and I was probably naive to expect that they could apply math outside the context of a math class. I should have given a little primer on how to estimate before calculating, how to check that your answer is right after calculating, etc. This is not really math; it's metacognition in a math context, and I'm now kicking myself for not emphasizing metacognition throughout this trimester with the upper graders.
In any case, we spent a lot of time on this activity: 1 hour, including the movie, before break; then maybe another 20 minutes after break. It was worth it to work through these issues, but then I did have to cut down on my planned post-break activity. I'll dedicate the next blog post to the humidity-related activities we did in the last 30 minutes of the morning.
Wednesday, March 20, 2013
Making Clouds in a Bottle
As our final activity in our March 12 physics-behind-the-weather extravaganza, we made clouds in a bottle, pretty much as shown in this video. This experiment shows that to form clouds we need three things: humid air, a change in temperature/pressure which brings the air below the dew point, and condensation nuclei, which are provided by particles in the smoke we waft into the bottle. Without these, water droplets tend not to form; see the Wikipedia article on supersaturation.
After many minutes of squeezing to see the clouds form and releasing to see the clouds disappear, they tended to stop forming. I think that must be due to the particles being driven into the liquid water rather than floating in the air.
This was a relatively quick (~15 minutes) activity, but I was surprised at how the kids had problems getting the smoke into the bottle. They didn't think about how the bottle had to exhale before it could inhale the smoke. I didn't trust the kids with matches, so I was quite busy servicing the kids as they each tried to get smoke multiple times. My advice to teachers is to have several adults help if you do this with a larger number of kids.
Friday, March 15, 2013
Balloon in a bottle
This is a great demo for making air pressure dramatically visible.
The "bottle" is a special flask with a hole in the bottom. Stuff most
of a limp balloon into the neck of the flask, mount the balloon's neck
onto the flask's neck, and inflate the balloon. When you take your
mouth off the balloon, it deflates, of course. Ask your audience to
predict what will happen if you put the stopper in before taking your
mouth off. Now inflate the balloon again, insert the stopper in the
hole at the bottom of the flask, take your mouth off, and TA-DA! The
balloon does not deflate, despite having its mouth held wide open by
the neck of the flask! This is really an astounding demo, and people
are delighted every time I do it.
The key to understanding this is that inflating the balloon pushes air
out of the flask through the hole in its bottom. With no stopper, air
rushes back in through the same hole when the balloon deflates. But
with a stopper, pulling air back in to the flask is not possible. As
soon as the balloon deflates just a tiny bit, the same amount of air
in the flask must occupy a larger volume, which means it lowers its
pressure. Each square inch of latex in the balloon's surface now
starts to feel a higher pressure from the inside of the balloon than
from the outside of the balloon, so it can't deflate any more.
(Experts: I am purposely omitting surface tension to keep it
simple for a young audience.) If you now remove the stopper, it
quickly deflates by drawing air into the flask through the newly made
hole.
There are further variations such as pouring water in the balloon
before removing the stopper (which creates a nice squirt of water when
you do remove the stopper).
If you can't find this specialized flask, you may be able to do a
similar demo with a regular bottle by using a straw in parallel with
the balloon to vent the bottle as you inflate the balloon. From the
videos I've seen, it takes some dexterity and practice to do this and
remove the straw to prevent further air flow at the critical moment,
but it is doable.
I did this Tuesday with the upper-graders at Peregrine School to
introduce pressure to our study of weather. Pressure is related to
temperature; pumping up a bike tire shows that compressing a gas
raises its temperature, and there are demos I will describe in a
future post which show how cooling a gas makes its pressure drop. So
hot air masses are associated with high pressure, and cool air masses
(and storms) are associated with low pressure. In low-pressure storms
like hurricanes, air is pushed from higher-pressure regions on the
periphery toward the center. Combining this with what we had just
learned about the Coriolis effect, we see that in the northern
hemisphere air will be deflected to its right, making a
counterclockwise circulation which is easily seen in satellite images:
In the southern hemisphere, air is deflected to its left as it tries
to go from outskirts to center, thus creating clockwise circulation.
We saw in our previous activity that the Coriolis effect cannot
determine the circulation in toilet bowls because a few inches' travel
is too small to be affected by riding on the 12,000-mile
merry-go-round we call Earth. But over hundreds of miles, the
Coriolis effect does build up and cause these wind patterns.
The next and last activity in our physics-behind-the-weather extravaganza was making clouds.
Thursday, March 14, 2013
Coriolis Effect
After learning how convection makes air "want" to circulate from
equator to pole at high altitudes and back from pole to equator at low
altitudes, we learned how that idealized picture of air flow is
modified by the Coriolis effect.
I won't explain the effect here, because there are plenty of good Web
resources on that, with MIT providing perhaps the best demo. As a
teacher, my quandary was whether to simply show the video of this
demo, or to try to actually do it in class. I took a risk on the
latter, and it worked out amazingly well. I built something like the
contraption shown in the MIT video, by borrowing a sturdy turntable (a
low one, much lower than a pottery turntable, so that a fall from it
would not hurt) and clamping a 2"x12"x8' plank to it. I put a kid on
each end, asked them to take some practice throws, and the spun it and
had them throw at will. They had a blast! Everyone insisted on taking
a turn---multiple turns---so we had plenty of chances to explore the
effects of different variables, such as direction of rotation, speed
of rotation, and distance over which the ball travels. When break
time arrived, the kids just kept playing with it, and kids from other
grades also came in the room and demanded their turn. I can honestly
say this was the most fun science activity I have done with kids.
They begged me to leave the device at school, but I did not leave it
because it would require constant adult supervision to keep it safe.
I strongly urge anyone teaching the Coriolis effect to do this
activity. The activity described in this post took about an hour, but
kids could play with this device for many hours. If you don't think
you can build one, a merry-go-round should provide a good substitute.
Back in discussion mode, we took some time to understand that Earth's
northern hemisphere is like a merry-go-round spinning
counterclockwise, so when low-altitude air tries to circulate from
pole to equator it gets deflected to the right and becomes a wind from
the northwest, whereas when high-altitude air tries to circulate from
equator to pole it gets deflected to the right and becomes a wind from
the southwest. This means that one giant circulation cell from
equator to pole and back is not feasible; it gets broken up into three
cells, from equator to about 30 degrees latitude, from 30-60 degrees
latitude, and from latitude 60 to the pole:
 |
| (Image from Wikipedia) |
The sourthern hemisphere is like a merry-go-round spinning clockwise,
so its air circulation cells (called Hadley cells) are a mirror image
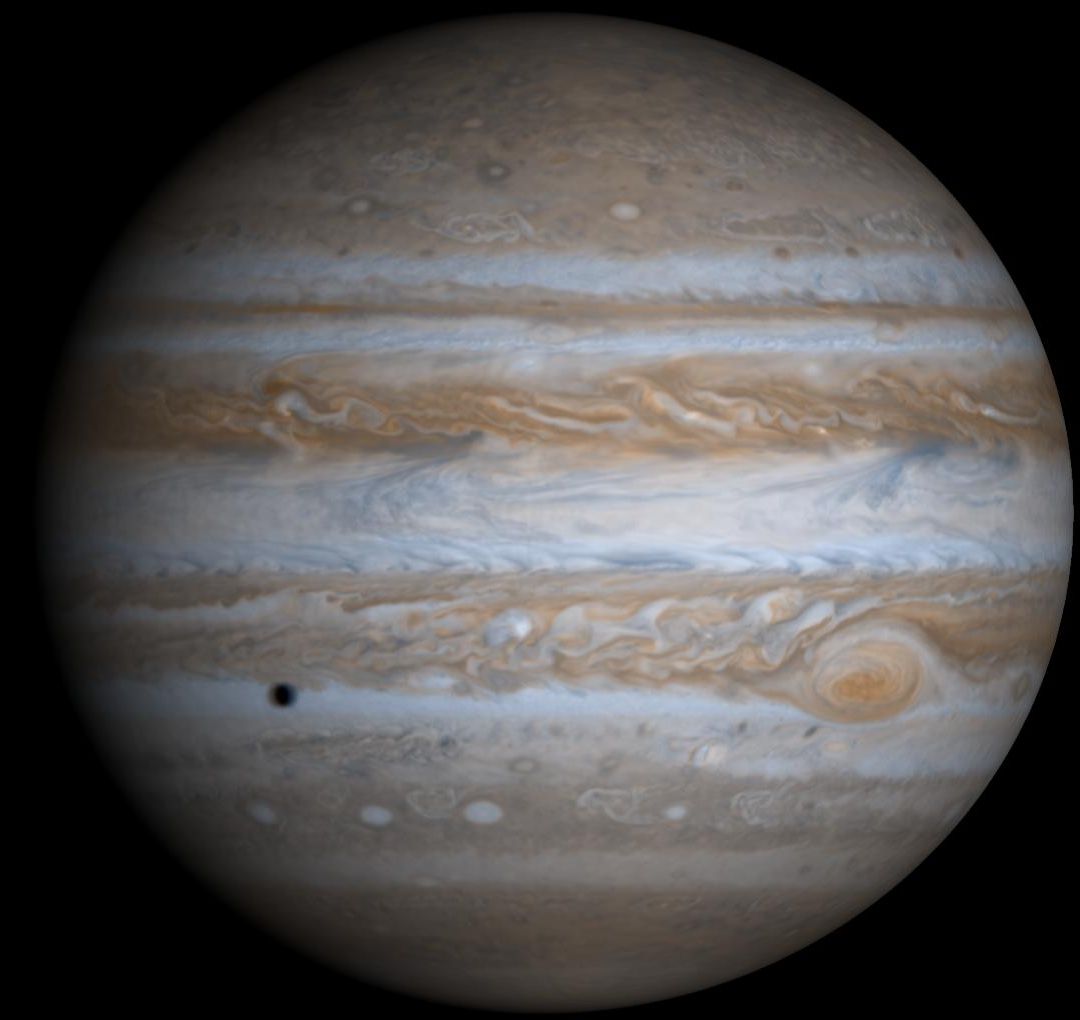
of the north's. On a faster-spinning planet such as Jupiter, the Coriolis effect
is much stronger and therefore the equator-to-pole tendency is broken up
into more cells. Each cloud band in this photo represents a cell:
An important thing to note about the Coriolis effect is that it does
not determine the direction of toilet flushes. Our experiment showed
that when traveling distances which are short compared to the diameter
of the merry-go-round, the ball is not noticeably deflected. Water
traveling a few inches from rim to center of a toilet ball is
traveling only a tiny, tiny fraction of the Earth's diameter, so the
Coriolis effect cannot be important. What is important is how water
is injected into the bowl.
I reinforced that idea by showing this video from a travel documentary,
whose producers and stars are completely taken in by locals living on the
equator purporting to demonstrate that water drains in different
directions just north of the equator vs just south of the equator. As
you watch this video, can you spot a major mistake the locals make?
Also, can you explain how the locals got the water to drain in
different directions at will?
In the next activity, we explored how the Coriolis effect also explains why storms like hurricanes circulate counterclockwise in the northern hemisphere and clockwise in the southern hemisphere.
Tuesday, March 12, 2013
Convection and Weather
This morning I guided the upper-graders at Peregrine School through a
set of weather-related activities.
First, we reviewed what we had learned previously about energy in the
Earth-Sun system. Briefly, although the Earth's core is very hot and
slowly cooling off due to heat flowing outward through the surface,
the vast majority of heat that we experience comes from the Sun. How
could we figure that out from everyday observations? Julia nailed it:
the surface temperature varies quite a bit from pole to equator and
from day to night, which is indicative of the Sun rather than of a
constant flow of heat outward in all directions from the Earth's core.
We also reviewed how the Sun heats the ground, not the air (because
air is transparent to visible light); air near the ground is heated by
the ground and that heat then gets mixed throughout the atmosphere.
Whenever something is heated from the bottom, as our atmosphere is,
you get convection (one of the three forms of heat transport we had
discussed earlier).
Convection is the reason we have weather. Hot air rises, cool air
sinks, and so air is always in motion. To assess the solidity of
their understanding of convection, I immersed a shot-glass full of hot
water (dyed red) into a big container of cool water (dyed ever so
slightly yellow to provide contrast), but first, I asked them to make
predictions about what would happen. This is a really nice, really
simple experiment or demo. You can see the hot fluid rising in wisps;
eventually all the red collects on the top half of the large
container. But the true test of understanding is predicting what
happens when I immerse a shot-glass full of cool water into a big
container of warm water. The kids showed a good understanding by
predicting that the cool water would not rise at all, and just stay in
the shot-glass (and the bit of cool water which might spill in the
process of setting the shot glass down in the large container would
also settle on the bottom of the large container). In weather, this
is called an inversion: if cold air gets under a layer of warm air, it
is trapped there, and among other things air pollution can build up in
a city where there's an inversion. (The Wikipedia article on inversion
has some decent pictures, and a Google image search on "weather
inversion" also yields some nice pics.)
Convection transports heat in the oceans as well as in the atmosphere.
There are ocean currents which circulate warm equatorial water toward
northern regions and bring cold water from the north back down toward
the equator to get warmed up again. The sea off California's coast is
rather cold because the current here comes from Alaska.
But the takeaway message of this part of the day (which took probably
only 20-25 minutes) is that the Sun provides the energy for moving air
around, which makes weather happen. Because of the way the Sun's
energy hits Earth, hot air must rise from equatorial regions and cold
air must sink near the poles. But the only way for this to be
sustainable is with a "conveyor belt": hot air which rises from
equatorial regions moves toward the poles, where it cools, sinks, and
moves along the surface back toward the equator. This creates wind
and weather patterns. Our next activity was designed to add more
nuance to this general idea.
Before proceeding to the next activity, I presented the class with a
lava lamp for long-term loan. This will constantly remind them of
convection even when I'm not there!
Saturday, March 2, 2013
Climate Change
Yesterday we tied together California (Grade 6) Science Standards 6
(resources), 3 (Heat), and 4 (Energy in the Earth System). We'd
already done quite a bit of 3 and 4, so we started with a discussion
of resources. The consequences of using resources (6a) led naturally to
the greenhouse effect, which builds on our previous understanding of
heat flow in the Earth-Sun system. We had previously calculated a
rough temperature that Earth "should" be at, ie the stable temperature
at which Earth should radiate just as much heat into space (in the
form of infrared light) as it gets from the Sun (mostly in the form of
visible light). This temperature was just below freezing, and it
turns out that a natural greenhouse effect makes Earth livable.
We started with this video, which is a nice short demo of how carbon
dioxide absorbs infrared light. C02 is by no means the only
greenhouse gas; water vapor is also very important, and methane
absorbs much more infrared light on a gram-for-gram basis, but there
is not enough methane in the atmosphere to make it the most important
greenhouse gas overall. We also watched a short clip of another
video, which demonstrated how the temperature of a bottle of carbon
dioxide increased more than a bottle of air when both were heated by a
lamp. This latter experiment requires only basic equipment and a
teacher might consider having the kids do the experiment, but I
suspect the experiment could be finicky in real life: you will have to
make sure there are no leaks in the C02 bottle, etc.
The kids were ahead of me on this one. They had already made the leap
to climate change, but I wanted to do at least a quick review to fill
in the logic. The atmosphere is basically transparent to visible
light, the form in which we get energy from the Sun; if it's not
transparent to infrared light, the form in which Earth gets rid of its
heat, then Earth must heat up. As stated above, we need a certain
amount of natural greenhouse effect to avoid freezing over, but there
can be too much of a good thing. We spent the rest of the time in
small groups, playing with a computer simulation of all this. This
simulation is really good, so I encourage you to click Run Now (it
takes a minute to load and start). You can adjust the level of
greenhouse gases from none (to see our previous calculation in action)
to lots. As I circulated around the groups, we discussed the effect
of clouds (keep us cooler during the day but warmer at night) vs
greenhouse gases (always keep us warmer). We also looked at the
Photon Absorption tab, which shows what's going on microscopically.
You can shoot visible or infrared photons (the smallest unit of light)
at a variety of molecules to see which are greenhouse gases. In the
main (Greenhouse Effect) tab, the view is too zoomed out to see what
the photons are interacting with when they bounce around. This was a
successful activity: students learned something as they explored, and
some students worked into their recess break to finish answering the
questions on the worksheet.
(Maven alert: it's common to say that greenhouse gases "trap" heat,
but this is not technically correct. It's more accurate to say that
they impede the flow of energy. I didn't correct the kids when they
said "trap", but teachers should be aware of this. Saying "trap" as a
teacher leaves you open to refutation.)
After the recess break, we discussed feedback loops and the
physics/engineering definition of positive and negative feedback
(which have nothing to do with psychological concepts such as negative
reinforcement or positive attitude). I asked them to classify 11
different situations as positive or negative feedback (eg, foxes
provide negative feedback on the rabbit population), and they did very
well, so the concept is possibly less challenging than I imagined. We
briefly discussed how confusing it is to have delayed feedback (eg
Alice says something to Bob and three days later he raises his voice).
Psychological experiments have shown that when feedback is delayed a
long time, people get very confused as to what causes what: they think
their actions have no effect, or the opposite effect. (For more on
this, I recommend the book The Logic of Failure.)
So it is with climate change. Scientists knew of CO2's heat
"trapping" properties more than a century ago and predicted rising
temperatures as we dumped more CO2 into the atmosphere, but it takes
so long for the heat to build up that it's easy to ignore. By the
time we really see the temperature rise in a very convincing way, we
have dumped so much C02 into the atmosphere that temperatures will
rise much more even if we take immediate action. Compounding this is
variability: if you just pay attention to the temperatures in your
neighborhood, there is so much variability from day to day and season
to season that it's impossible to notice a change in the average
temperature. To see the change, you have to average together many
thousands of temperature measurements.
Even after getting people to accept that line of reasoning, they will be
unimpressed by the global average change so far: 1.4 degrees Fahrenheit.
What's a degree or two between friends? But the change has been much
larger in some regions (the Arctic) and even 1.4 degrees results in a lot of
dislocation and expense: species have to adjust their ranges all over the world,
malaria may be able to move further from tropical regions, etc. Won't Canada
and the northern US be happy to be a little bit warmer? Maybe, but it's not that
simple. Rain patterns may shift, so farmers in Canada may not be so happy after
all. And northern forests are being destroyed at a rapid rate now that certain
kinds of beetles can survive the winter further north; beetles are mobile, but trees
are not, and the northern trees will be destroyed before they have time to
adapt to the beetle. And areas which do gain from climate change may
be overrun with refugees from areas which lose big-time.
Anyway, the delayed-feedback idea led into the carbon cycle. Over
tens of thousands of years the carbon cycle will remove excess carbon
from the atmosphere, so the Earth will not get hotter without limit
(thus answering an earlier question from a student).
Our final activity was looking at this interactive flood map. Seas
rise because the ocean heats up and expands (a very slow process) and
because of melting glaciers (not as slow, but still not easy to
predict). The standard prediction for the year 2100 (when these
students will be old, but quite possibly still alive) is about 1 meter
of sea level rise, so I asked the students to dial in 1 meter and
answer a few questions about impacts on their house and on nearby
areas. But the slowness of the ocean expansion means that the impact
of the current amount of carbon is further down the road, and has been
estimated to be 21 meters. So I asked the students to dial in 21
meters and answer a few more questions. This was another successful
activity combining student exploration with learning; I urge readers
of this blog to try the interactive flood map as well. Twenty-one
meters seems insane, so some kids need to be reassured that it will be
slow, over hundreds of years and perhaps a thousand years, so people
will have time to evacuate and adjust. Still, evacuation and
adjustment are costly financially and emotionally so it may be better
to prevent the need for so much evacuation and adjustment in the first
place.
I didn't have time for a few things I wanted to show, but I can link to them here.
First, a quick Google image search for "glacier comparison" shows how fast most
glaciers are melting. It is astounding*. Second 30 seconds from this story about the
documentary Chasing Ice provide another dramatic look at glacier melting. (Sorry,
you will probably have to watch an ad to see this, but I couldn't find a better link.)
P.S.: Another important point for teachers of this subject is to emphasize that
"global warming" doesn't mean "every part of the Earth warms all of the time."
There is a model behind the predictions, a model with moving parts which affect
each other so that the predictions are richer than a novice imagines. For example,
a warmer atmosphere will also be a more humid atmosphere, so many areas will
get more precipitation and more intense storms. If you live in a place where it's
cool enough to snow occasionally, then yes, global warming predicts that you can
get more snow. People who think a big snowstorm contradicts predictions of
climate models simply haven't taken the time to get familiar with what climate
models really predict. A scientific model should make a rich set of nuanced
predictions: that makes it easier to set up stringent experimental tests of the model.
This nuance does mean that scientists must work harder to educate the public. If
any scientists are reading this, I plead with you to put in that hard work. Society
needs you.
*Climate change deniers have recently made a big deal about a study showing that glaciers in some parts of the Himalayas are actually growing. Note the qualified phrase "some parts of the Himalayas." This is NOT what's happening to most glaciers around the world. As noted above, climate change may have some "winners" as well as losers. But I doubt the "winners" will feel very secure with so much dislocation in the world.
Subscribe to:
Posts (Atom)