Our third activity last Friday was on radioisotope dating. (Everyone
has heard of carbon dating but carbon is just one of many radioactive
isotopes used for dating, and not even the most useful one for
geology, as we'll see below.) This tied in with the other two
activities, because a certain age pattern in seafloor rocks was a
prediction generated by students' model of continental motions. So
how do we measure the ages of rocks?
I prepared a whole bunch of small pieces of paper which were purple on
one side and white on the other. Each group got a handful and put
them all purple-side up. These represent potassium-40 atoms. Each
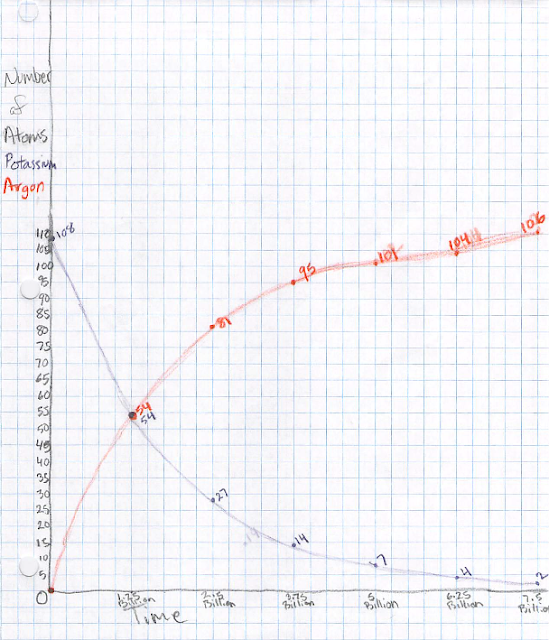
group started constructing a graph of the number of potassium-40 atoms
vs time. Let's say we start with 100 such atoms at a time we call
zero (we'll see later what this really means). Over 1.25 billion
years, half of the potassium-40 atoms decay into argon-40 atoms. The
students represent this by flipping over half of the "atoms" so the
white side is up. Once flipped over, it can never flip back. One
analogy is that once a ball rolls downhill, it's not going to roll
back up; similarly the argon-40 atom is in a lower-energy state. (The
word "decay" evokes an irreversible process, for good reason.) So now
the student plots 50 atoms at a time of 1.25 billion years. After
another 1.25 billion years, half of the remaining potassium-40 atoms
decay, so we now have 25 left and we plot that. We may also want to
keep track of the number of argon-40 atoms, so (in a different color
pencil) we put zero of those atoms at time zero, 50 at 1.25 billion
years, and 75 at 2.5 billion years.
Keep going with this process. In another time step, the 25
potassium-40 atoms decay into 12 or 13 argon-40 atoms. An atom can't
be half-decayed, and there is an element of randomness in this
process, so you can flip a coin or just decide randomly if it's 12 or
13. (Aficionados will recognize that there is some probability of 11
or 14 as well, but that's beyond the scope here.) Keep going until
you run out of graph paper, then connect the dots.
Now, how can we tell how old a rock is? Look at the ratio of potassium-40 to
argon-40 atoms: 1:0 at the start, 1:1 at t=1.25 billion years, 1:3
at 2.5 billion years, 1:7 at 3.75 billion years, etc. Measuring this
ratio provides an unambiguous estimate of the age of the rock. I had
the kids field a few practice questions where I would give an age and
they would give a ratio or percentage, or vice versa. (If you're more comfortable
with percentages, as a percentage of the total potassium-40+argon-40 atoms, it's
100% potassium-40 at the start, 50% at 1.25 billion years, 25% at 2.5 billion
years, 12.5% at 3.75 billion years, etc.)
But what do we mean by the "age" of a rock? This is really key to
understanding the whole thing. Argon is a gas, so when a rock is
molten the argon will just bubble out. So when a rock solidifies, it
has no argon atoms, and a 1:0 ratio of potassium-40 to argon-40 atoms.
So t=0 corresponds to the last time that the rock solidified, which is
exactly the tool we need to date the age of new ocean floor oozing out
of the mid-Atlantic ridge!
The half-life of potassium-40 is well suited to dating rocks because
so many of them are so old. What if we wanted to date something
younger, like a human skeleton from an archaeological dig? Even if it
was 4000 years old, the ratio of potassium-40 to argon-40 would be so
close to 1:0 that we wouldn't be able to tell. We need something with
a shorter half-life, like carbon-14, which decays to carbon-12 with a
half-life of only 5730 years. Carbon-14 is great for dating
skeletons, but if we tried to use it to date a rock, we would most
likely find zero carbon-14 left so we would only be able to say that
it's many half-lives old. To say that a rock is at least 10 of those
half-lives, or about 60,000 years old, is not very useful.
(Teacher warning: a lot of the implementation details are different
for carbon-14 dating. For instance, there is never a 1:0 ratio of
carbon-14 to carbon-12, not even close. So adapting this exercise to
carbon dating would be tricky.)
This was a good activity for the 25 minutes we had left. I wouldn't
try to squeeze this activity into any less time, but we definitely
could have used more time. For example, we could have plotted the
ratio; used our computer skills to make plots, including of the ratio;
brought in some algebra to calculate things quickly through an
equation rather than graphically; etc.

No comments:
Post a Comment